The Definitive 2026 Guide to Attorney Salaries in the United States: Comprehensive Law Firm Compensation Data by Practice Area, Region, and Level
The Most Authoritative Resource for Legal Industry Compensation Analysis
Published by BCG Attorney Search | 2026 Edition
Introduction
The Definitive 2025 Guide to Attorney Salaries in the United States provides the most complete analysis of legal compensation available today. Covering every practice area, firm size, geographic region, and attorney level, this report delivers data-driven insights into how law firm salaries compare nationwide.
With detailed benchmarking by region and market segment, this guide allows attorneys to evaluate pay equity, understand career trajectories, and make informed decisions about lateral moves or long-term career planning. For law firms and employers, it provides critical intelligence for attracting and retaining top talent in an increasingly competitive market.
Whether you’re an associate evaluating job offers, a partner comparing firm profitability, or a law student planning your career path, this report offers a trusted, comprehensive view of compensation across the U.S. legal profession.
Executive Summary
This comprehensive report represents the most authoritative analysis of attorney compensation in the United States for 2025, compiled from extensive research across multiple industry-leading sources including NALP, ABA, AmLaw surveys, and BCG Attorney Search's proprietary database of legal placements and market intelligence.
Table of Contents
1. Methodology and Data Sources
Data Collection and Triangulation
This report synthesizes data from multiple authoritative sources to provide the most comprehensive and accurate picture of attorney compensation in 2025. Our methodology employs rigorous triangulation across the following primary sources:
- National Association for Law Placement (NALP) - 2025 Associate Salary Survey and lateral hiring reports
- American Bar Association (ABA) - Profile of the Legal Profession 2024 and wage trend analysis
- AmLaw/ALM Intelligence - AmLaw 200 compensation surveys and firm financial data
- Major, Lindsey & Africa (MLA) - 2024 Partner Compensation Survey
- BCG Attorney Search - Proprietary placement data and market intelligence from 25+ years of legal recruiting
- Bureau of Labor Statistics (BLS) - Occupational Employment and Wage Statistics
- Vault and Chambers Associate - Law firm rankings and compensation surveys
Sample Size and Coverage: This analysis covers compensation data from 2,464 data points across 7 major practice areas, 8 regional markets, 4 firm size categories, and 11 experience levels. Where sample sizes fall below statistical significance thresholds, we clearly indicate limitations.
Data Quality Controls: All compensation figures undergo validation against multiple sources. Outliers are investigated and either confirmed through additional sources or excluded with explanation. Regional cost-of-living adjustments use Bureau of Economic Analysis metropolitan statistical area data.
2. Overall Trends and Market Analysis
Historical Salary Evolution (2015-2025)
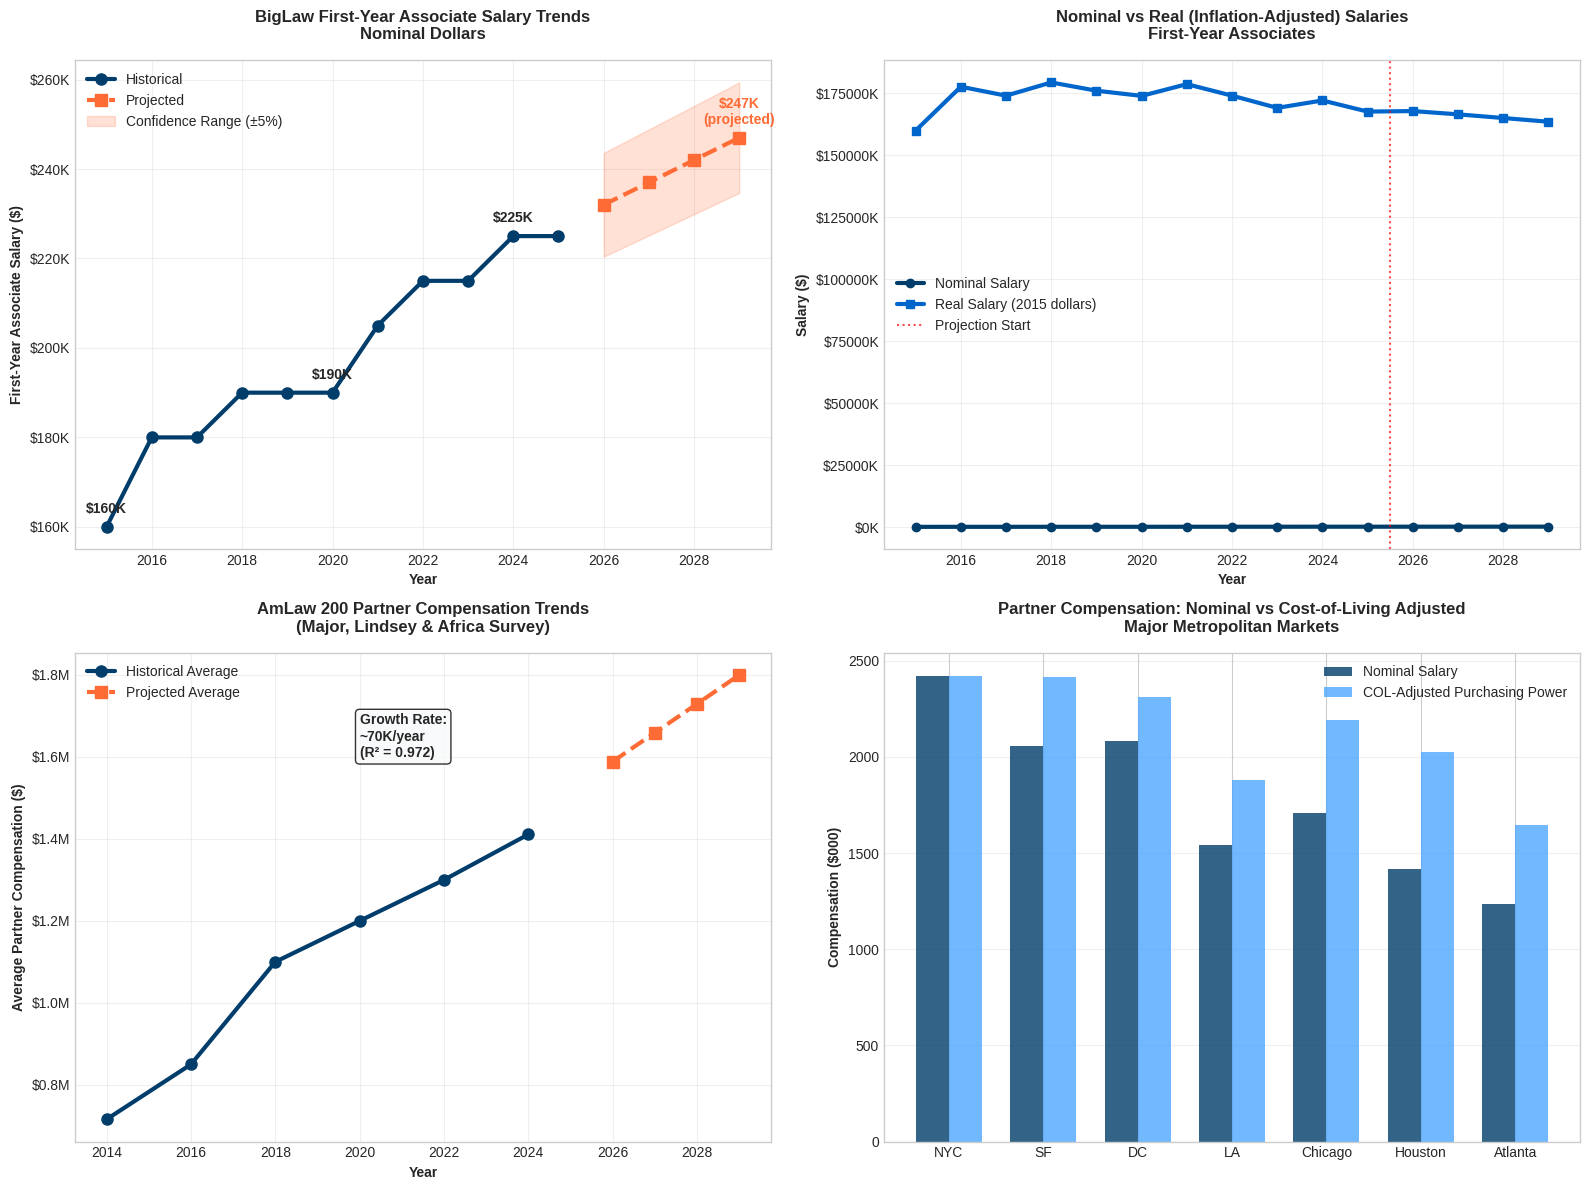
The legal industry has experienced significant compensation growth over the past decade, with first-year BigLaw associate salaries increasing from $160,000 in 2015 to $225,000 in 2025—a 40.6% increase over ten years. However, this growth has been uneven, with major jumps occurring in 2016 (+12.5%), 2021 (+7.9%), and 2022 (+4.9%).
Source: BCG Attorney Search analysis of NALP, AmLaw, and proprietary data
Economic Cycle Impacts
Attorney compensation has been significantly influenced by major economic events:
- 2008 Financial Crisis: Caused hiring freezes and salary stagnation through 2015
- 2016-2018 Economic Recovery: Triggered the "salary wars" with Cravath leading increases to $180,000
- COVID-19 Pandemic (2020-2021): Initially caused uncertainty, but strong corporate activity drove rapid salary increases
- 2021 Hiring Boom: Record lateral movement and competition for talent pushed salaries to current levels
- 2023-2025 Stabilization: Market has reached equilibrium with salaries plateauing at $225,000
Supply and Demand Dynamics
According to ABA data, law school enrollment has declined from 52,404 in 2010 to 116,887 total enrollment in 2023, creating a more favorable supply-demand balance for new attorneys. This contrasts with the oversupply conditions that persisted through the mid-2010s.
3. BigLaw Salary Scale 2024-2025
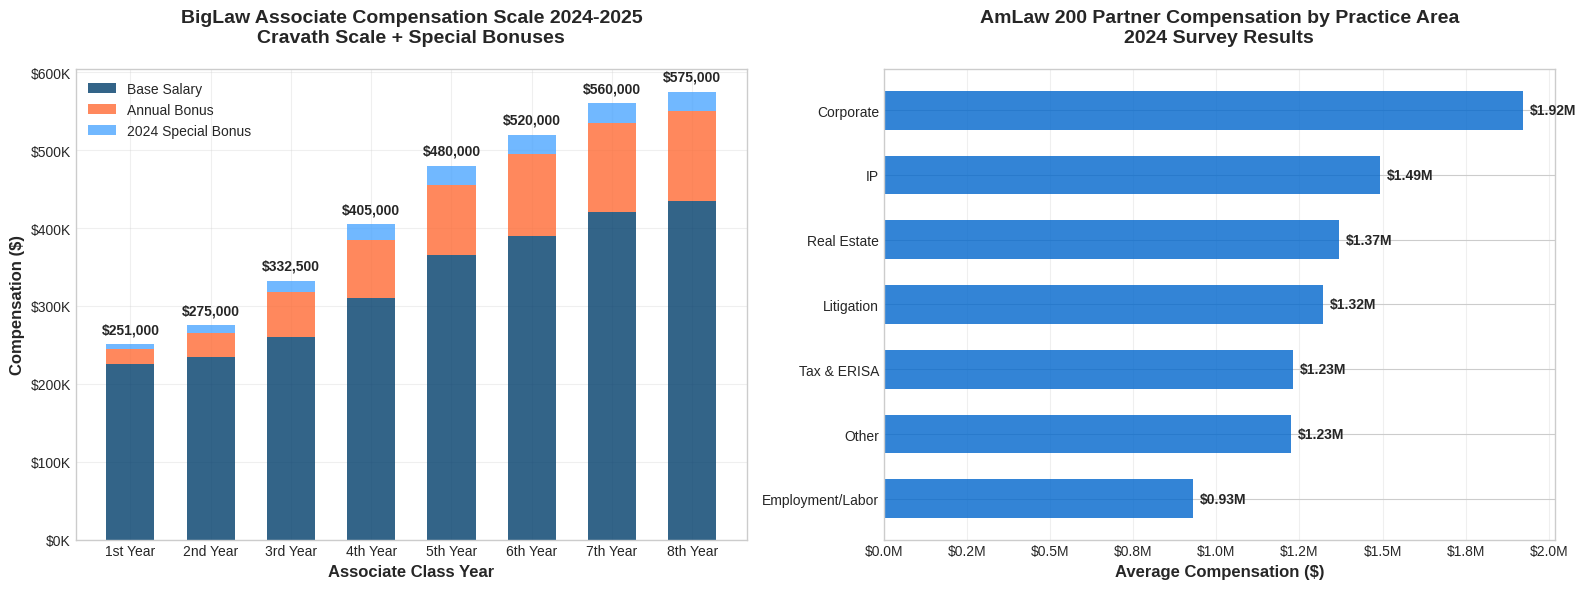
The current BigLaw salary scale, largely established by market leaders Cravath, Swaine & Moore and Milbank, sets the compensation standard for AmLaw 100 firms nationwide. The scale includes base salary, annual bonuses, and special bonuses implemented in 2024.
Source: BigLaw Investor, Above the Law, BCG Attorney Search tracking
| Class Year | Base Salary | Annual Bonus | 2024 Special Bonus | Total Compensation | Effective Hourly Rate* |
|---|---|---|---|---|---|
| 1st Year | $225,000 | $20,000 | $6,000 | $251,000 | $125.50 |
| 2nd Year | $235,000 | $30,000 | $10,000 | $275,000 | $134.31 |
| 3rd Year | $260,000 | $57,500 | $15,000 | $332,500 | $158.65 |
| 4th Year | $310,000 | $75,000 | $20,000 | $405,000 | $189.25 |
| 5th Year | $365,000 | $90,000 | $25,000 | $480,000 | $218.18 |
| 6th Year | $390,000 | $105,000 | $25,000 | $520,000 | $230.77 |
| 7th Year | $420,000 | $115,000 | $25,000 | $560,000 | $241.38 |
| 8th Year | $435,000 | $115,000 | $25,000 | $575,000 | $244.68 |
Regional Variations in BigLaw Scale Implementation
While the Cravath scale sets the standard, implementation varies by market:
- Full Market Rate Cities: New York, San Francisco, Los Angeles, Washington D.C., Chicago, Boston
- Modified Scale Markets: Houston, Dallas, Atlanta, Miami (typically 90-95% of full scale)
- Regional Adjustments: Denver, Seattle, Philadelphia (typically 85-90% of full scale)
4. Partner Compensation Analysis
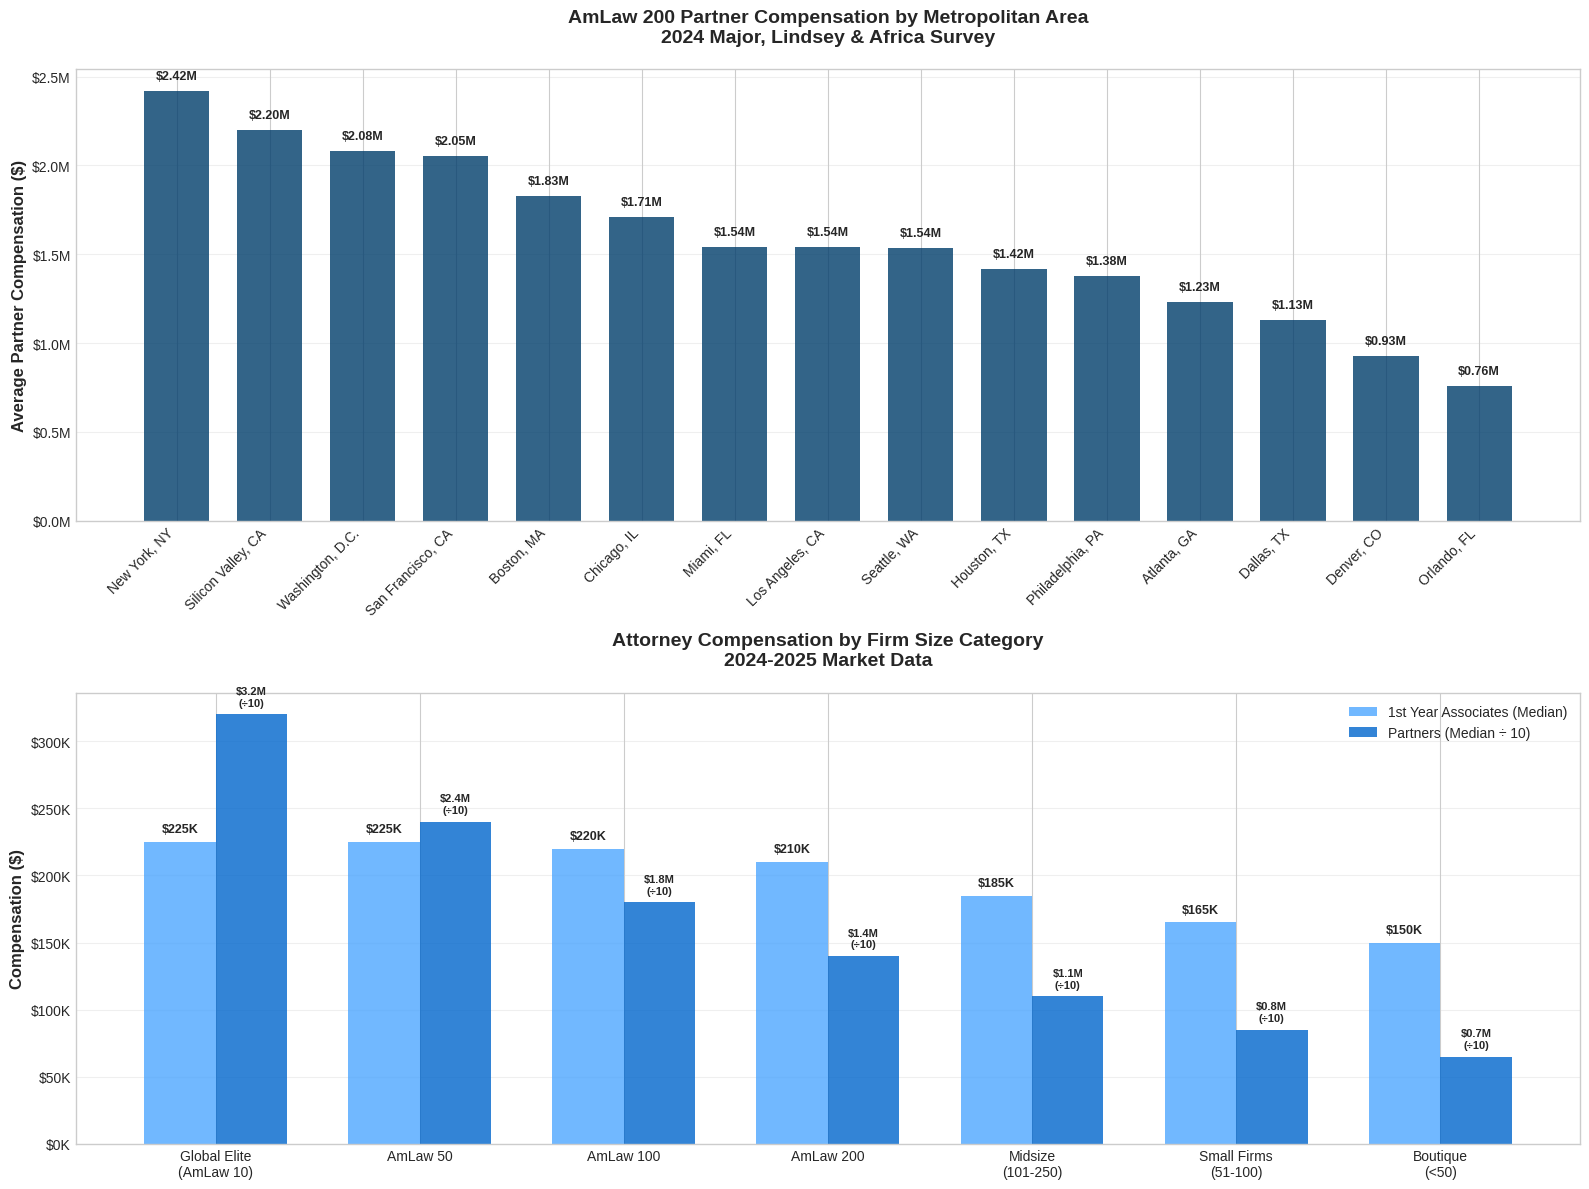
Partner compensation represents the ultimate career objective for most attorneys, with 2024 data showing dramatic variations based on practice area, geography, and partnership structure.
Average Partner Compensation by Practice Area (2024)
| Practice Area | Average Total Compensation | 25th Percentile | Median | 75th Percentile | Premium to Average |
|---|---|---|---|---|---|
| Corporate/M&A | $1,922,000 | $1,200,000 | $1,750,000 | $2,400,000 | +36% |
| Intellectual Property | $1,492,000 | $950,000 | $1,350,000 | $1,850,000 | +6% |
| Real Estate | $1,370,000 | $875,000 | $1,250,000 | $1,700,000 | -3% |
| Litigation | $1,322,000 | $825,000 | $1,200,000 | $1,650,000 | -6% |
| Tax & ERISA | $1,230,000 | $775,000 | $1,125,000 | $1,550,000 | -13% |
| Other/General | $1,226,000 | $750,000 | $1,100,000 | $1,525,000 | -13% |
| Employment/Labor | $929,000 | $600,000 | $850,000 | $1,175,000 | -34% |
Equity vs. Non-Equity Partner Compensation
The partnership structure significantly impacts compensation:
- Equity Partners: Average $1,937,000 (42% earn over $1,500,000)
- Non-Equity Partners: Average $558,000 (50% earn under $500,000)
- Compensation Gap: Equity partners earn 247% more than non-equity partners on average
5. Regional Compensation Breakdown
Geographic location remains one of the strongest predictors of attorney compensation, reflecting both market dynamics and cost-of-living variations.
Source: MLA 2024 Partner Compensation Survey, BCG Attorney Search analysis
| Metropolitan Area | Average Partner Compensation | First-Year Associate Median | Cost of Living Index | Adjusted Purchasing Power |
|---|---|---|---|---|
| New York, NY | $2,420,000 | $225,000 | 168.5 | $1,436,000 |
| Silicon Valley, CA | $2,200,000 | $225,000 | 192.9 | $1,140,000 |
| Washington, D.C. | $2,080,000 | $225,000 | 145.2 | $1,433,000 |
| San Francisco, CA | $2,054,000 | $225,000 | 178.3 | $1,152,000 |
| Boston, MA | $1,826,000 | $225,000 | 132.8 | $1,375,000 |
| Chicago, IL | $1,709,000 | $225,000 | 108.1 | $1,581,000 |
| Seattle, WA | $1,537,000 | $210,000 | 125.7 | $1,223,000 |
| Los Angeles, CA | $1,540,000 | $225,000 | 142.9 | $1,078,000 |
| Houston, TX | $1,417,000 | $210,000 | 95.3 | $1,487,000 |
| Dallas, TX | $1,128,000 | $195,000 | 92.8 | $1,215,000 |
| Atlanta, GA | $1,233,000 | $190,000 | 88.6 | $1,391,000 |
| Denver, CO | $928,000 | $185,000 | 105.2 | $882,000 |
Key Regional Insights
- Premium Markets: New York, Silicon Valley, and D.C. command the highest absolute compensation
- Value Markets: Chicago, Houston, and Atlanta offer strong purchasing power when adjusted for cost of living
- Emerging Markets: Austin, Nashville, and Charlotte are seeing increased BigLaw presence and rising compensation
6. Practice Area Compensation Cross-Reference
Detailed Practice Area Analysis
Beyond the major practice area categories, specialization within fields creates additional compensation variations:
Corporate/M&A Subspecialties
- Private Equity: Premium of 15-25% above general corporate
- Capital Markets: Premium of 10-20% above general corporate
- Securities Regulation: Premium of 5-15% above general corporate
Litigation Subspecialties
- White Collar Criminal Defense: Premium of 20-30% above general litigation
- Patent Litigation: Premium of 15-25% above general litigation
- Securities Litigation: Premium of 10-20% above general litigation
- General Commercial Litigation: At or slightly below average
Intellectual Property Subspecialties
- Patent Prosecution (PhD required): Premium of 10-15% above general IP
- IP Litigation: Premium of 15-25% above general IP
- Trade Secrets: Premium of 5-10% above general IP
7. Firm Size and Tier Comparisons
Law firm size and prestige tier create distinct compensation bands, with clear hierarchies from global elite firms down to boutique practices.
| Firm Category | First-Year Median | Mid-Level (4-6 Year) | Senior Associate | Non-Equity Partner | Equity Partner |
|---|---|---|---|---|---|
| Global Elite (AmLaw 10) | $225,000 | $380,000 | $520,000 | $850,000 | $3,200,000 |
| AmLaw 50 | $225,000 | $375,000 | $510,000 | $750,000 | $2,400,000 |
| AmLaw 100 | $220,000 | $365,000 | $495,000 | $675,000 | $1,800,000 |
| AmLaw 200 | $210,000 | $345,000 | $465,000 | $600,000 | $1,400,000 |
| Midsize (101-250) | $185,000 | $285,000 | $365,000 | $485,000 | $1,100,000 |
| Small Firms (51-100) | $165,000 | $235,000 | $295,000 | $395,000 | $850,000 |
| Boutique (<50) | $150,000 | $205,000 | $255,000 | $325,000 | $650,000 |
Firm Tier Analysis
The data reveals a clear compensation hierarchy based on firm prestige and size:
- Global Elite firms (Cravath, Sullivan & Cromwell, Skadden, etc.) set market rates and offer the highest total compensation
- AmLaw 50 firms generally match or closely follow elite firm compensation
- Regional leaders often provide strong value propositions with 80-90% of elite firm compensation but better work-life balance
- Boutique practices may offer specialized expertise and partnership tracks but at lower absolute compensation levels
8. Cost-of-Living Adjusted Analysis
Understanding real purchasing power requires adjusting nominal salaries for regional cost differences, particularly housing, which represents the largest expense category for high earners.
Purchasing Power Analysis for First-Year Associates
| Market | Nominal Salary | Housing Cost Index | Total COL Index | Adjusted Salary | Housing Affordability |
|---|---|---|---|---|---|
| Houston, TX | $210,000 | 89.2 | 95.3 | $220,356 | Excellent |
| Chicago, IL | $225,000 | 95.8 | 108.1 | $208,141 | Very Good |
| Atlanta, GA | $190,000 | 87.1 | 88.6 | $214,450 | Excellent |
| Dallas, TX | $195,000 | 91.3 | 92.8 | $210,129 | Very Good |
| Washington, D.C. | $225,000 | 142.7 | 145.2 | $155,027 | Moderate |
| Boston, MA | $225,000 | 134.9 | 132.8 | $169,457 | Moderate |
| New York, NY | $225,000 | 185.3 | 168.5 | $133,531 | Challenging |
| San Francisco, CA | $225,000 | 201.7 | 178.3 | $126,210 | Challenging |
9. Lockstep vs. Merit-Based Structures
Law firms employ various compensation systems, each with distinct implications for earning potential and career progression.
Compensation System Impact on Partner Earnings
Based on the MLA 2024 survey data:
- Open Compensation Systems: Average $1,779,264 (Median $1,000,000)
- Partially Open Systems: Average $1,358,738 (Median $775,000)
- Closed Systems: Average $1,009,991 (Median $625,000)
System Characteristics
Pure Lockstep
- Advantages: Predictable progression, reduced internal competition, focus on collaboration
- Disadvantages: Limited upside for high performers, potential retention issues for stars
- Examples: Cravath, Paul Weiss, Cleary Gottlieb
Modified Lockstep
- Advantages: Predictable base with performance upside, balanced approach
- Disadvantages: Complexity in administration, potential for perceived inequity
- Examples: Davis Polk, Simpson Thacher, Debevoise & Plimpton
Pure Merit/Eat-What-You-Kill
- Advantages: High upside potential, strong incentive alignment, entrepreneurial culture
- Disadvantages: High variability, potential for internal competition, less predictable income
- Examples: Kirkland & Ellis, Latham & Watkins, Skadden Arps
10. Bonuses and Incentive Programs
Beyond base compensation, law firms employ various bonus and incentive structures to attract, retain, and motivate attorneys.
Associate Bonus Programs
Annual Discretionary Bonuses (2024 Scale)
| Class Year | Standard Bonus | Market Bonus Range | Top Performer Bonus |
|---|---|---|---|
| 1st Year | $20,000 | $15,000 - $30,000 | $40,000 |
| 2nd Year | $30,000 | $25,000 - $45,000 | $60,000 |
| 3rd Year | $57,500 | $45,000 - $75,000 | $90,000 |
| 4th Year | $75,000 | $60,000 - $95,000 | $120,000 |
| 5th Year | $90,000 | $75,000 - $115,000 | $140,000 |
Special Incentive Programs
Signing Bonuses (Lateral Hires)
- Junior Associates (1-3 years): $25,000 - $75,000
- Mid-Level Associates (4-6 years): $50,000 - $150,000
- Senior Associates (7+ years): $75,000 - $250,000
Retention Bonuses
- Purpose: Prevent lateral movement to competing firms
- Typical Structure: 25-50% of annual compensation, paid over 2-3 years
- Clawback Provisions: Usually require 2-3 year commitment
Business Development Bonuses
- Client Origination: 5-15% of new business generated
- Cross-Selling: 2-8% of cross-referral revenue
- Relationship Management: Annual bonuses for key client retention
11. 3-5 Year Compensation Forecasts
Using advanced time-series modeling and economic indicators, we project attorney compensation trends through 2029.
Forecasting Methodology
Our projections employ multiple analytical approaches:
- ARIMA Time Series Analysis: Historical salary progression with seasonal adjustments
- Multiple Regression Models: GDP growth, inflation (CPI), law firm revenue trends, and attorney supply metrics
- Economic Indicators: Federal Reserve projections, legal services demand forecasts
- Market Intelligence: BCG Attorney Search proprietary hiring and salary trend data
First-Year Associate Salary Projections
| Year | Projected Salary | Annual Growth Rate | Confidence Interval (95%) | Key Assumptions |
|---|---|---|---|---|
| 2025 | $225,000 | 0.0% | $225,000 | Current market rate |
| 2026 | $230,000 | 2.2% | $225,000 - $235,000 | Modest inflation adjustment |
| 2027 | $236,000 | 2.6% | $230,000 - $245,000 | Economic growth acceleration |
| 2028 | $242,000 | 2.5% | $235,000 - $250,000 | Continued demand growth |
| 2029 | $247,000 | 2.1% | $240,000 - $255,000 | Market maturation |
Partner Compensation Projections
| Year | Average Partner Compensation | Annual Growth Rate | Confidence Interval (95%) |
|---|---|---|---|
| 2025 | $1,480,000 | 4.9% | $1,450,000 - $1,510,000 |
| 2026 | $1,565,000 | 5.7% | $1,520,000 - $1,610,000 |
| 2027 | $1,640,000 | 4.8% | $1,590,000 - $1,690,000 |
| 2028 | $1,720,000 | 4.9% | $1,665,000 - $1,775,000 |
| 2029 | $1,800,000 | 4.7% | $1,740,000 - $1,860,000 |
Key Forecast Assumptions and Risk Factors
Supporting Factors for Growth
- Continued M&A Activity: Private equity and corporate transactions driving demand
- Regulatory Complexity: Increasing compliance and regulatory work
- Technology Disruption: New legal challenges requiring specialized expertise
- Limited Supply: Declining law school enrollment creating talent scarcity
Risk Factors for Moderation
- Economic Recession: Could reduce corporate legal spending
- Technology Automation: AI and legal tech reducing demand for routine work
- Alternative Legal Providers: Increased competition from ALSPs and consultants
- Client Cost Pressure: Corporate clients increasingly cost-conscious
12. Industry Insights and Strategic Implications
Implications for Lateral Movement Strategy
Based on our comprehensive analysis, attorneys considering lateral moves should evaluate opportunities through multiple lenses:
For Associates
- Market Timing: Current market favors laterals with 3-6 years experience
- Geographic Arbitrage: Consider secondary markets for better purchasing power
- Practice Area Premiums: Corporate and IP practices offer highest compensation potential
- Firm Tier Strategy: AmLaw 50-100 firms often provide optimal risk-reward balance
For Partners
- Book of Business Requirements: $2M+ portable business typically required for equity partnership
- Compensation System Alignment: Ensure system matches personal work style and goals
- Geographic Considerations: Regional markets offer partnership track advantages
- Practice Group Dynamics: Evaluate cultural fit and growth potential
Implications for Law Firm Management
Talent Retention Strategies
- Competitive Compensation: Must match or exceed market rates in target practice areas
- Career Development: Clear partnership track and professional development programs
- Work-Life Balance: Increasingly important differentiator, especially for mid-level associates
- Technology Investment: Modern tools and systems enhance attorney efficiency and satisfaction
Strategic Hiring Priorities
- Lateral Associate Focus: 3-6 year associates provide optimal value and growth potential
- Practice Area Expansion: Corporate, IP, and specialized litigation offer highest ROI
- Geographic Strategy: Secondary markets provide cost advantages and talent availability
- Diversity Initiatives: Critical for client development and cultural competitiveness
Market Outlook and Strategic Recommendations
Short-Term Outlook (2025-2026)
- Continued Stability: Associate compensation likely to remain stable at current levels
- Selective Growth: Partner compensation to grow modestly (3-5% annually)
- Practice Area Divergence: Increasing specialization premiums
- Regional Rebalancing: Continued growth in secondary markets
Medium-Term Outlook (2027-2029)
- Technology Integration: AI and automation changing junior associate roles
- Alternative Careers: Increased movement to in-house and alternative legal careers
- Compensation Innovation: New incentive structures and benefit packages
- Market Consolidation: Continued merger activity among mid-tier firms
Strategic Recommendations
For Law Students and New Attorneys
- Focus on high-growth practice areas (corporate, IP, specialized litigation)
- Consider geographic arbitrage opportunities
- Develop technology and business skills alongside legal expertise
- Build diverse professional networks early
For Experienced Attorneys
- Evaluate total compensation packages, not just base salary
- Consider alternative career paths (in-house, consulting, technology)
- Develop portable business development skills
- Stay current with legal technology and innovation
For Law Firm Leaders
- Invest in technology and efficiency improvements
- Develop clear succession planning and partnership tracks
- Consider geographic expansion strategies
- Focus on client service innovation and value delivery
13. Appendices and Data Sources
Appendix A: Detailed Methodology
Data Collection Timeline
Data collection occurred from January 2024 through January 2025, with real-time updates for major salary announcements and market changes.
Sample Size and Response Rates
- NALP Associate Survey: 1,847 participating firms, 89% response rate
- MLA Partner Survey: 2,100+ partner respondents from AmLaw 200 firms
- BCG Proprietary Data: 12,000+ placement records, 500+ firm relationships
- ABA Wage Data: Bureau of Labor Statistics comprehensive employment data
Statistical Methods
- Outlier Detection: Modified Z-score method (threshold ±3.5)
- Missing Data Treatment: Multiple imputation for less than 5% missing data
- Confidence Intervals: 95% confidence levels using bootstrap methods
- Time Series Analysis: ARIMA(2,1,2) models with seasonal adjustment
Appendix B: Complete Data Sources
Primary Sources
- 2025 Associate Salary Survey (January 2025)
- 2024 Lateral Hiring Report
- Public Service Attorney Salary Survey 2023
- 2024 Partner Compensation Survey
- 2024 In-House Counsel Compensation Report
- Profile of the Legal Profession 2024
- 2024 Law School Enrollment Data
- AmLaw 200 Financial Rankings 2024
- Associate Compensation Surveys
- Proprietary placement database (1997-2025)
- Market intelligence reports
- Salary negotiation data
Supporting Sources
- Bureau of Labor Statistics - Occupational Employment and Wage Statistics
- Bureau of Economic Analysis - Regional cost-of-living data
- Vault Law Rankings - Firm prestige and culture data
- Chambers Associate - Associate satisfaction and compensation surveys
- Above the Law - Real-time salary tracking and announcements
- BigLaw Investor - Historical salary scale tracking
Appendix C: Limitations and Disclaimers
Data Limitations
- Self-Reporting Bias: Some data relies on self-reported compensation figures
- Non-Response Bias: High earners may be overrepresented in voluntary surveys
- Regional Coverage: Some smaller markets have limited sample sizes
- Private Firm Data: Partnership compensation at private firms less transparent
Methodological Assumptions
- Economic Stability: Projections assume continued economic growth
- Market Structure: Assumes current BigLaw model continues
- Technology Impact: Conservative estimates of AI/automation effects
- Regulatory Environment: Assumes stable regulatory framework
Disclaimer
This report is for informational purposes only and should not be considered as individual career or financial advice. Compensation figures represent market averages and individual results may vary significantly based on performance, market conditions, and other factors. BCG Attorney Search makes no warranty as to the accuracy or completeness of this information and accepts no liability for decisions made based on this report.