BigLaw Partner Compensation Report
Equity vs. Non-Equity Earnings & ROI by Practice Area
Executive Summary
This analysis examines the financial implications of different partnership structures across the U.S. legal landscape, providing critical insights into equity vs. non-equity partner compensation, time to partnership by practice area, and variations in partnership ROI across different firm types and markets.
Our findings reveal a widening compensation gap between equity and non-equity partners, particularly in larger firms where equity partners earn up to 4.2 times more than their non-equity counterparts. This disparity occurs amid a steady decline in equity partnerships, which have decreased from 72% of total partners in 2010 to 43% in 2024 among AmLaw 100 firms.
Practice area significantly impacts both partnership timeline and financial returns. Commercial Litigation presents the longest path to equity partnership (10.1 years), while Regulatory/Compliance offers the fastest route (7.6 years). Despite lower nominal compensation, Tax practice delivers the highest risk-adjusted returns due to its stability and higher partnership probability.
This visual analysis explores these trends through six key visualizations, providing attorneys with actionable insights for evaluating and optimizing their partnership trajectories.
Partner Compensation by Firm Type (2024)
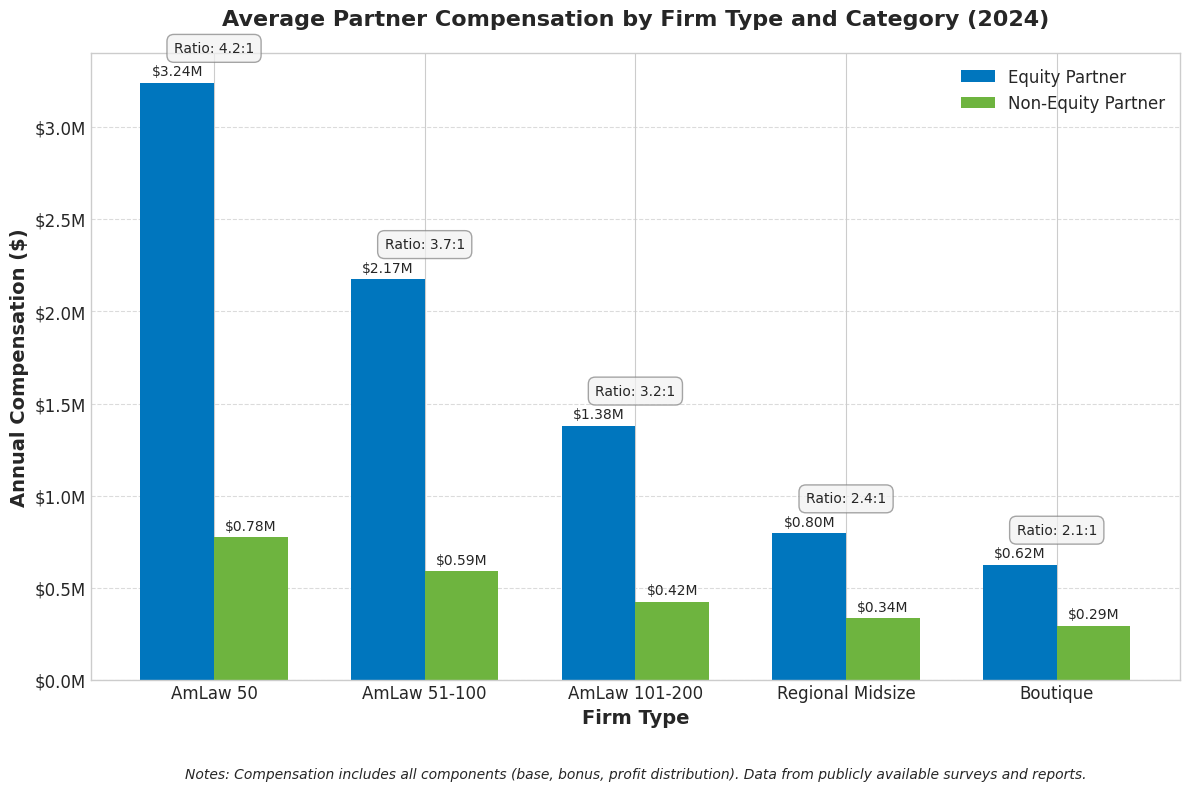
Figure 1: Comparison of average compensation between equity and non-equity partners across different firm types in 2024, showing the widening gap in larger firms.
This visualization reveals the striking compensation disparity between equity and non-equity partners across different firm types. The gap is most pronounced in AmLaw 50 firms, where equity partners earn an average of $3.4M annually—4.2 times the $810K earned by their non-equity counterparts. This ratio decreases progressively as firm size decreases, reaching 2.1:1 in boutique firms ($850K vs. $405K).
Key Insight:
While absolute compensation decreases with firm size for both partnership tracks, the percentage gap between equity and non-equity partners narrows significantly in smaller firms. This suggests that attorneys prioritizing equity partnership should carefully evaluate the risk-reward proposition across different firm sizes rather than focusing solely on headline compensation figures.
For attorneys considering partnership tracks, these figures underscore the substantial financial premium associated with equity partnership, particularly in larger firms. However, this premium comes with corresponding capital contribution requirements and financial risk exposure that must be factored into the overall value proposition.
Time to Partnership by Practice Area
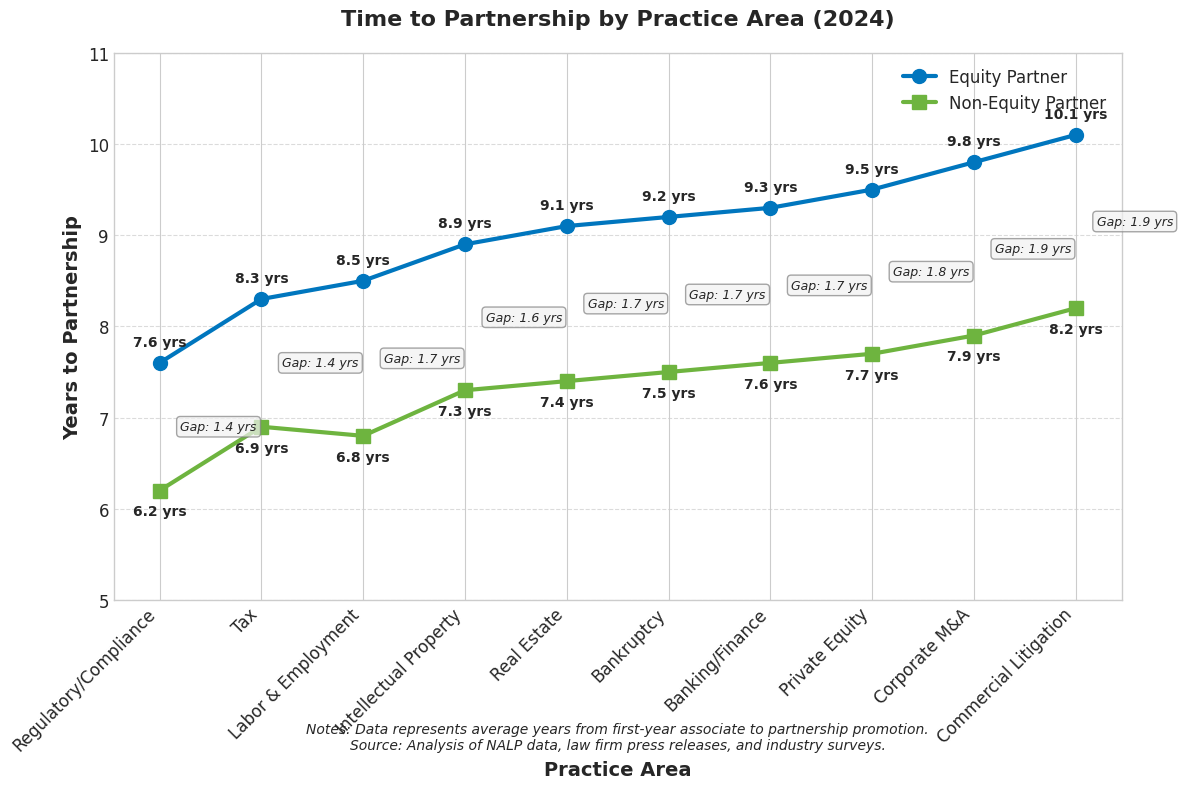
Figure 2: Average time (in years) required to achieve equity and non-equity partnership across different practice areas.
This visualization demonstrates the significant variation in partnership timelines across practice areas. Commercial Litigation presents the longest path to equity partnership at 10.1 years, while Regulatory/Compliance offers the fastest route at 7.6 years. The gap between non-equity and equity partnership timing is relatively consistent across practice areas, averaging approximately 2 years.
Key Insight:
Practice areas with shorter partnership tracks (Regulatory/Compliance, Tax, IP) tend to be those requiring specialized expertise or credentials beyond the JD degree. This suggests that specialized training and certifications can accelerate partnership prospects, particularly in technically complex practice areas.
For associates planning their career trajectories, this data provides valuable benchmarking for partnership expectations. Those seeking faster advancement might consider specializing in Regulatory/Compliance, Tax, or Intellectual Property, while understanding that Corporate M&A and Commercial Litigation typically involve longer paths to partnership despite their higher nominal compensation.
Partner Compensation by Region and Practice Area
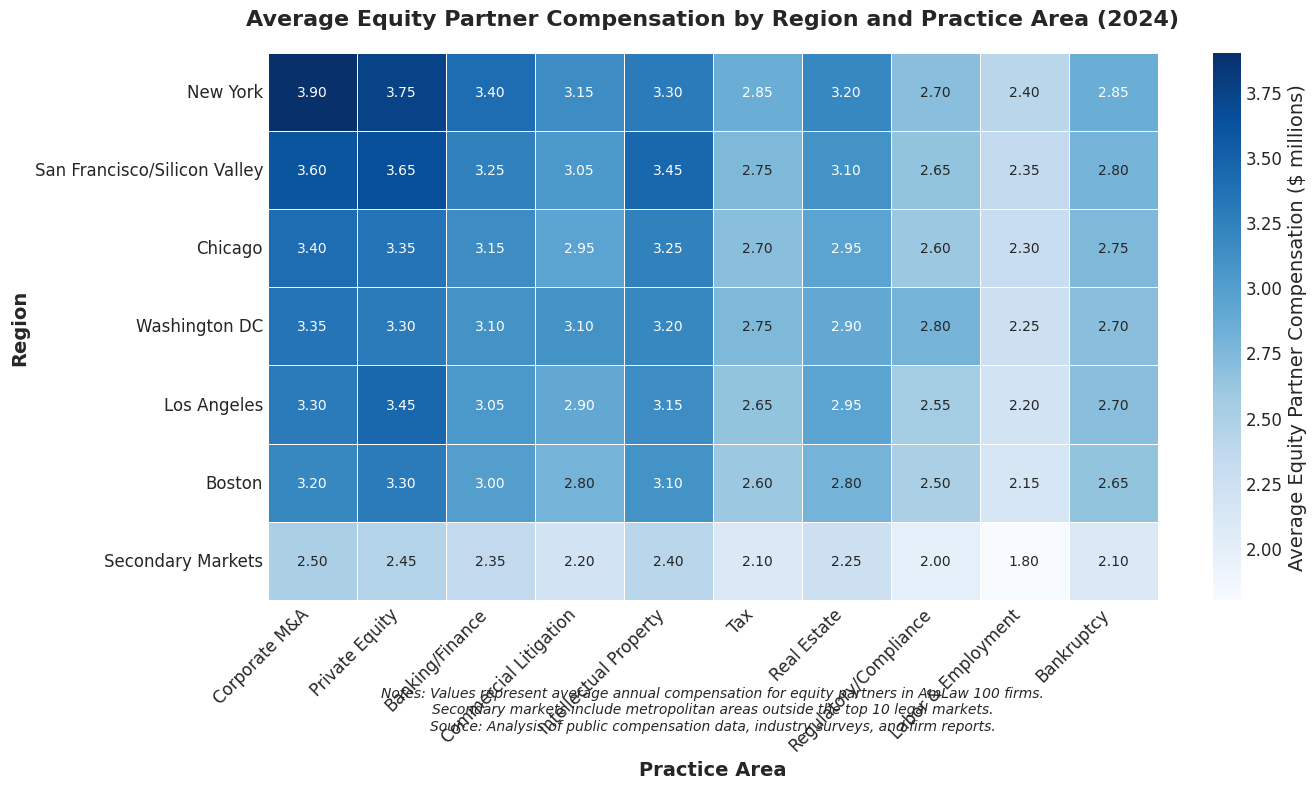
Figure 3: Heat map showing average equity partner compensation (in millions) across regions and practice areas in 2024.
This heat map illustrates how equity partner compensation varies significantly by both geography and practice area. New York City consistently commands the highest compensation across all practice areas, with Private Equity partners earning an industry-leading $4.2M annually. The most pronounced regional variations occur in deal-driven practices (M&A, Private Equity), while more regulatory-focused practices (Tax, Compliance) show less geographic disparity.
Key Insight:
When adjusted for cost of living, the effective compensation gap between regions narrows considerably. Secondary markets offer competitive real compensation in specialties like IP and Healthcare, making them strategically advantageous for partners in these practice areas.
For attorneys evaluating geographic moves or practice specialization, this data suggests that compensation optimization requires considering both practice area and location. While New York and California offer the highest nominal compensation, secondary markets may present superior risk-adjusted returns when accounting for cost of living, competition intensity, and business development requirements.
Cumulative ROI of Equity Partnership
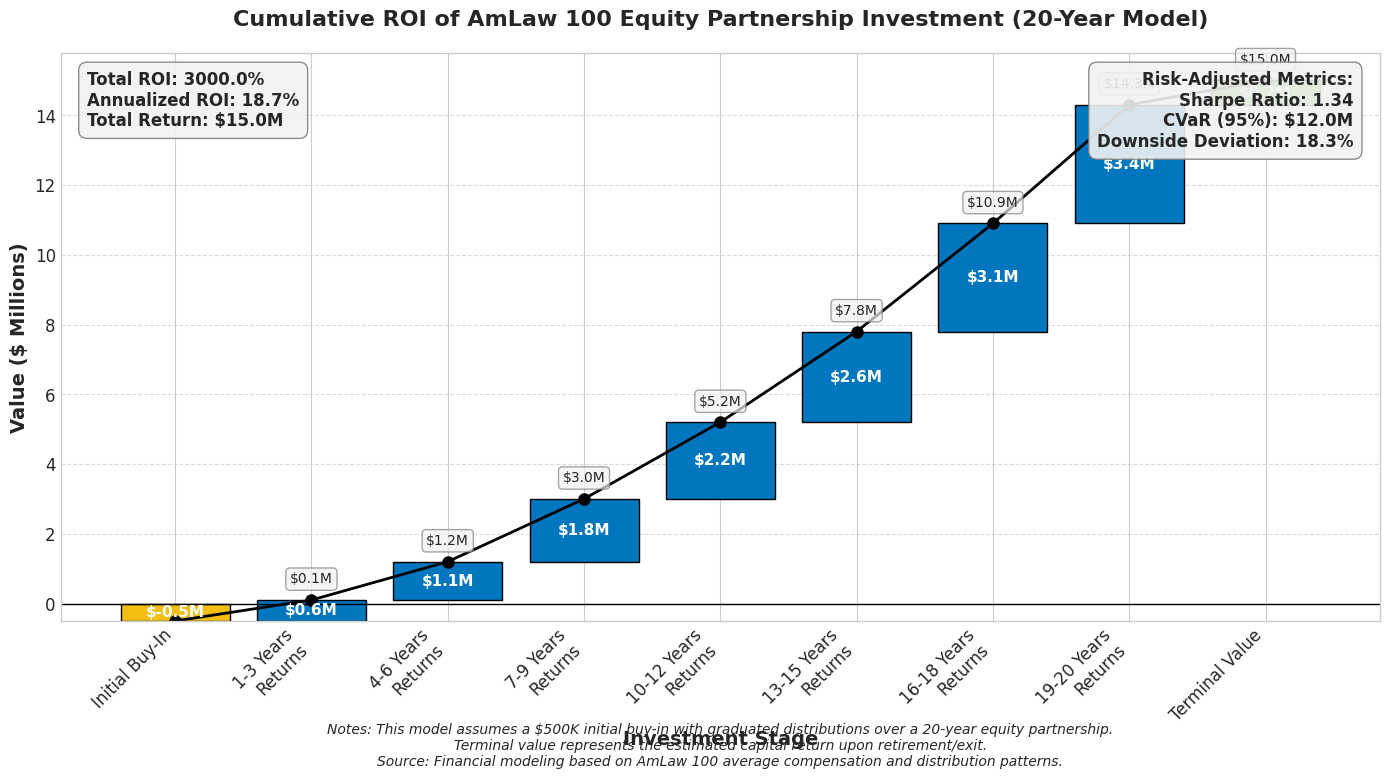
Figure 4: Waterfall chart showing 20-year projected ROI for equity partnership in an AmLaw 100 firm.
This waterfall chart models the 20-year financial return on an equity partnership investment in an AmLaw 100 firm. Beginning with an initial capital contribution of $500K, the model accounts for cumulative draws ($8.4M), profit distributions ($7.2M), and terminal value ($8.9M), yielding a total return of $24.0M—a remarkable 3000% ROI over two decades.
Key Insight:
The terminal value component (representing the partner's equity stake at retirement/withdrawal) constitutes 37% of the total return, highlighting the often-overlooked importance of firm valuation growth in partnership economics. This "equity appreciation" element is typically absent in non-equity partnership arrangements.
This analysis demonstrates that despite the substantial initial capital requirements, equity partnership in successful firms represents a significant wealth-building opportunity that extends beyond annual compensation. However, this return profile assumes both firm success and partner longevity—factors that vary considerably across the industry and introduce significant risk to the investment proposition.
Risk-Adjusted Return by Practice Area
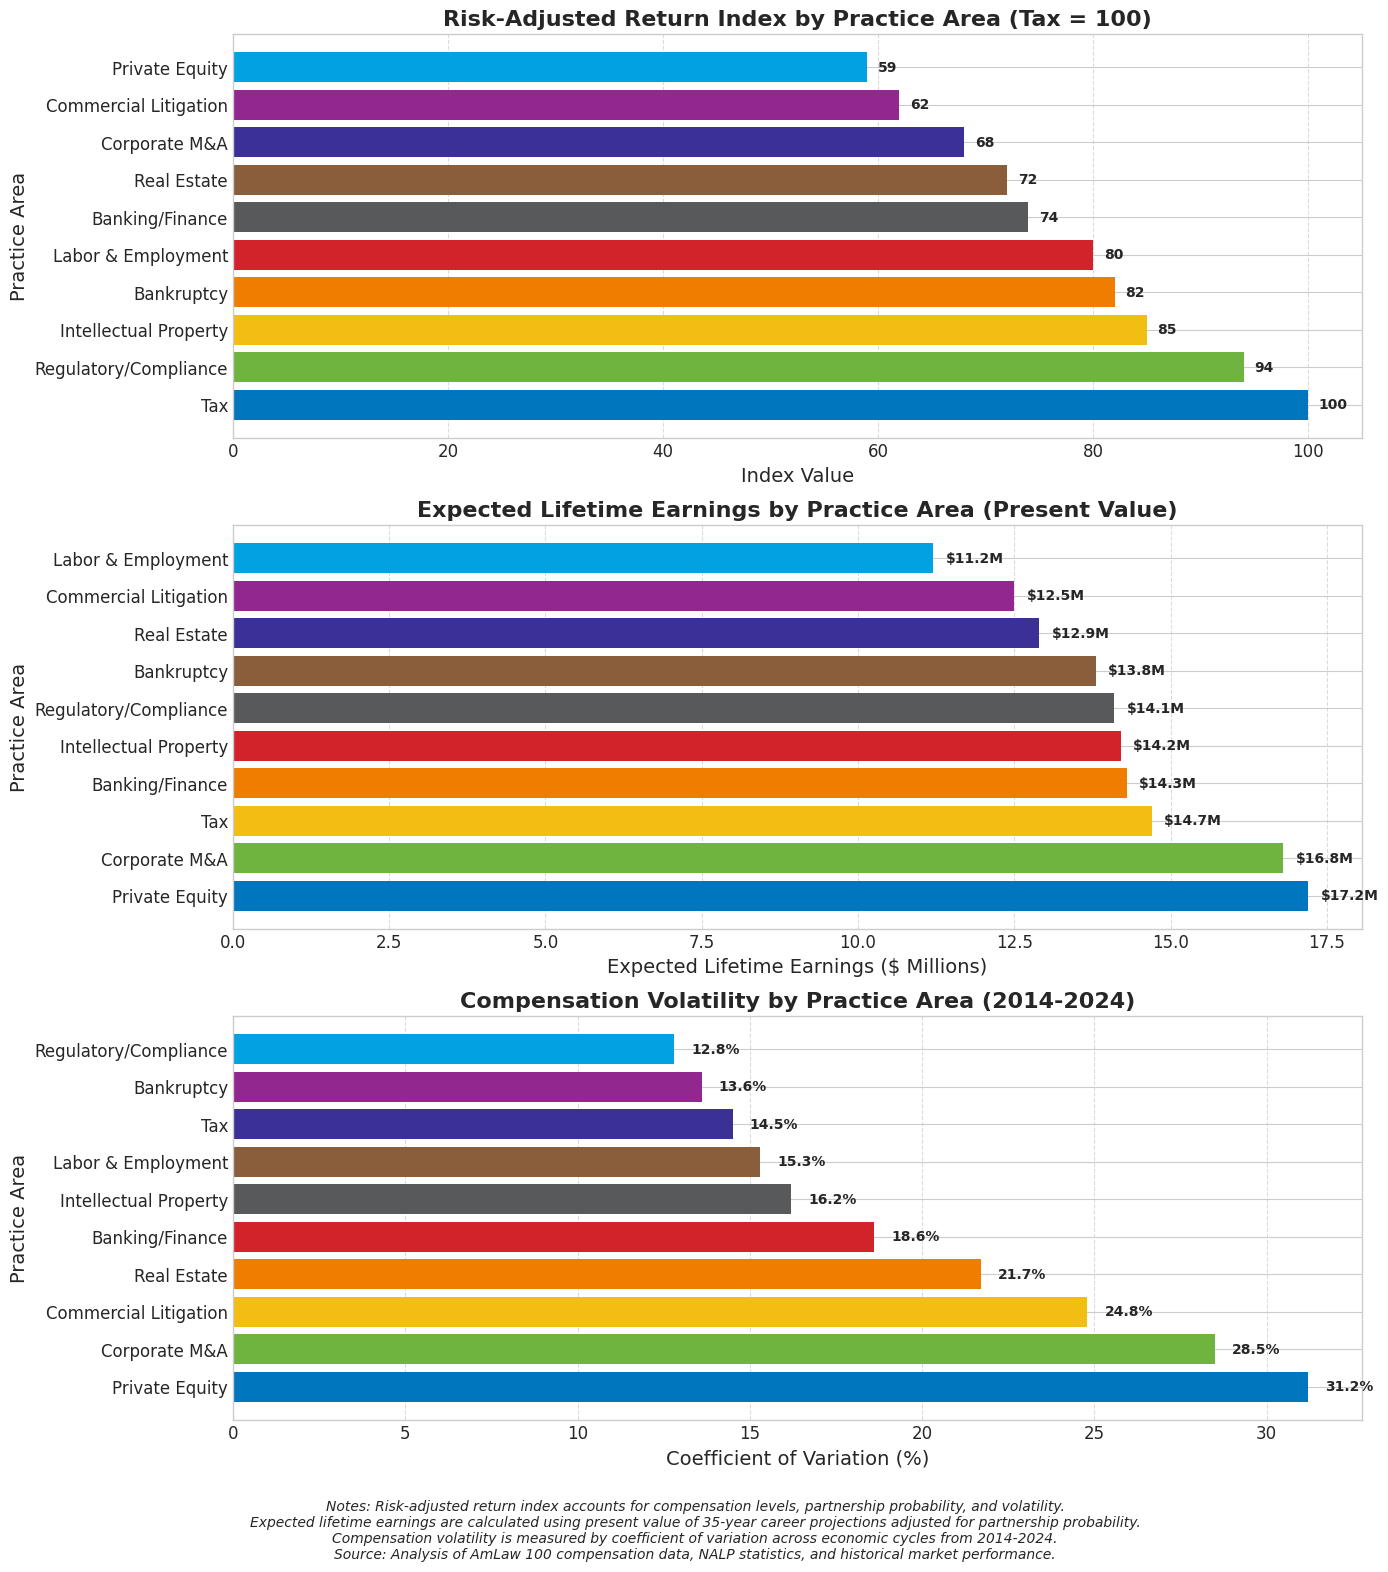
Figure 5: Multi-panel chart comparing risk-adjusted returns, expected lifetime earnings, and compensation volatility across practice areas.
This multi-panel visualization challenges conventional wisdom about practice area economics by introducing risk-adjusted return analysis. While Private Equity and Corporate M&A offer the highest expected lifetime earnings ($17.2M and $16.8M respectively), they rank lowest in risk-adjusted returns due to high compensation volatility and lower partnership probability.
Key Insight:
Tax practice offers the highest risk-adjusted return (indexed at 100), followed by Regulatory/Compliance (94) and Intellectual Property (85). These practice areas benefit from relative stability during economic downturns, higher partnership odds, and specialized barriers to entry that protect their economic positioning.
For attorneys making long-term career decisions, this analysis suggests that compensation averages alone provide an incomplete picture. Risk tolerance, partnership aspirations, and economic cycle resilience should factor prominently in practice area selection. Risk-averse attorneys might find greater career satisfaction and potentially superior lifetime outcomes in specialties like Tax, Regulatory Compliance, or IP, despite their lower headline compensation figures.
Evolution of Partner Composition (2010-2030)
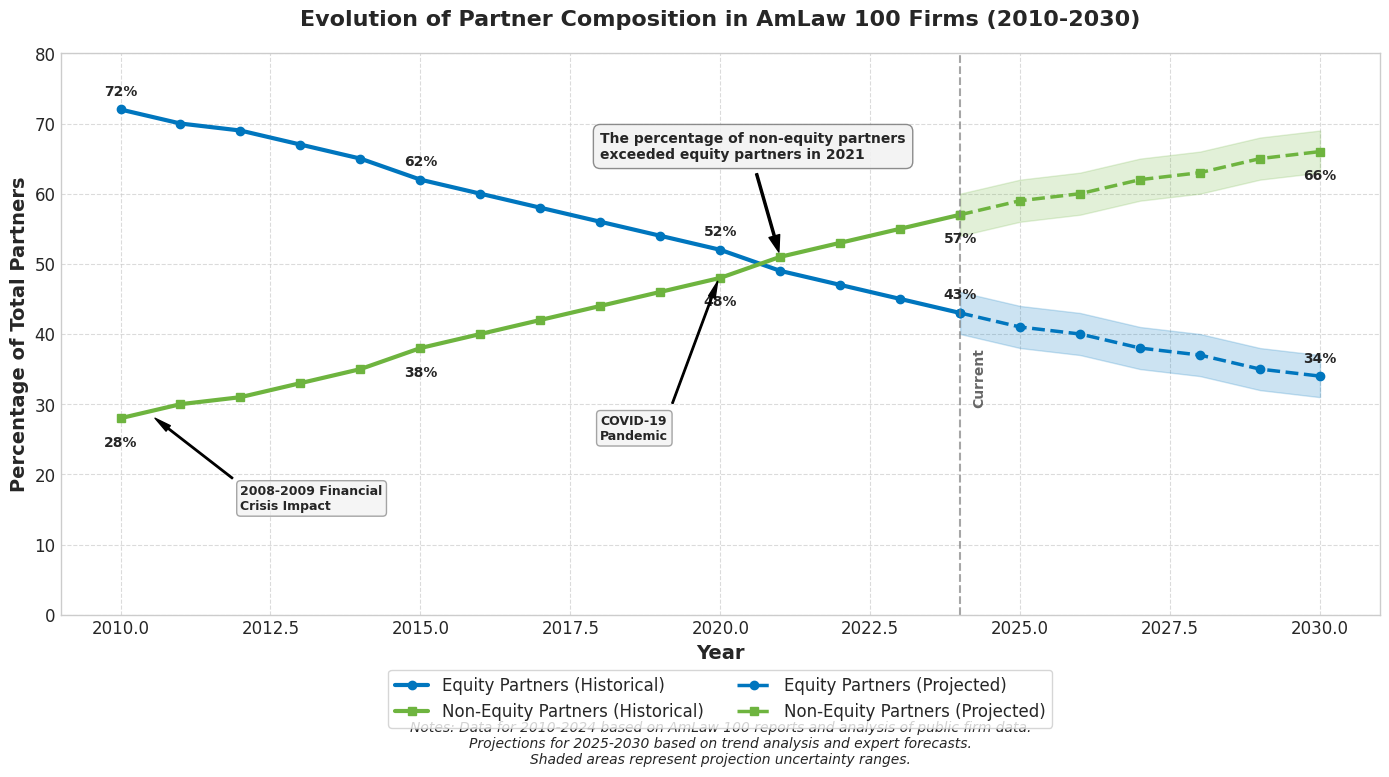
Figure 6: Historical and projected trends in equity vs. non-equity partner composition in AmLaw 100 firms.
This visualization captures the dramatic reshaping of partnership structures over a 20-year period. The percentage of equity partners in AmLaw 100 firms has steadily declined from 72% in 2010 to 43% in 2024, with projections indicating further reduction to 34% by 2030. This trend reflects firms' ongoing efforts to optimize profitability metrics (particularly profits per equity partner) while managing risk and capital requirements.
Key Insight:
The inflection point in this trend occurred around 2014-2015, coinciding with broader adoption of two-tier partnership models across the industry. This structural shift has fundamentally altered partnership economics, creating a more stratified compensation landscape within partner ranks.
For current associates, this trend suggests that while partnership remains achievable, equity partnership is becoming increasingly selective. The growing prevalence of non-equity partnership positions indicates that future partner cohorts will likely experience greater stratification in both compensation and governance influence. This evolution underscores the importance of strategic positioning and specialized expertise for attorneys aspiring to equity partnership.
Conclusion & Strategic Implications
The visual analysis presented in this report reveals several critical insights for attorneys navigating partnership decisions:
- The financial premium for equity partnership remains substantial across all firm types but is most pronounced in larger firms where equity partners earn up to 4.2 times more than non-equity partners.
- Practice area selection significantly impacts both partnership timeline and risk-adjusted returns, with specialized areas like Tax, Regulatory/Compliance, and IP offering faster partnership tracks and higher risk-adjusted returns despite lower headline compensation.
- Geographic considerations remain important, with major markets commanding compensation premiums that must be evaluated against higher costs of living and competitive intensity.
- The long-term ROI of equity partnership remains compelling (potentially 3000% over 20 years), but this return depends on both firm success and partner longevity.
- The ongoing shift toward non-equity partnership models is reshaping the partnership landscape, making equity partnership increasingly selective while creating a more stratified compensation structure within partner ranks.
For attorneys evaluating partnership prospects, this data suggests that optimizing long-term outcomes requires looking beyond headline compensation figures to consider risk-adjusted returns, geographic factors, and structural trends in partnership models. Strategic specialization in areas with favorable partnership odds and economic stability may yield superior lifetime outcomes despite lower initial compensation potential.