The Attorney's Playbook for Business Generation
Proven Strategies, Real Examples, and a Complete Implementation Plan
Data-Driven Business Development for Legal Professionals
Executive Summary
This comprehensive playbook analyzes the business development strategies of a $20-million producer from BCG Attorney Search, transforming their proven methodologies into actionable frameworks that any attorney can implement. Through data-driven insights and systematic approaches, this guide provides the roadmap to sustainable business growth in the legal profession.
Key Insights from Analysis
- Referrals dominate: 380% ROI makes referral systems the highest-impact investment for attorneys
- Timing matters: Strategic outreach timing can increase response rates by 133% (28% vs 12%)
- Systematic approach: Consistent activity trumps sporadic high-effort campaigns
- Long-term value: Average client lifetime value exceeds $125,000 with proper retention
- Content multiplication: One strategic article generates 8+ touchpoints and 2-5 qualified leads
Table of Contents
Strategic Foundation
Implementation Systems
Self-Assessment Diagnostic
Before implementing new strategies, assess your current business development position. Check all items that apply to your current practice:
Current Business Development Activities
Technology & Systems
Scoring Guide
- 8–10 checks: Advanced – Focus on optimization and scaling existing systems
- 5–7 checks: Intermediate – Systematize current activities and add missing components
- 2–4 checks: Developing – Prioritize foundational systems before advanced strategies
- 0–1 checks: Beginner – Start with basic CRM and systematic outreach processes
Client Acquisition Funnel Analysis
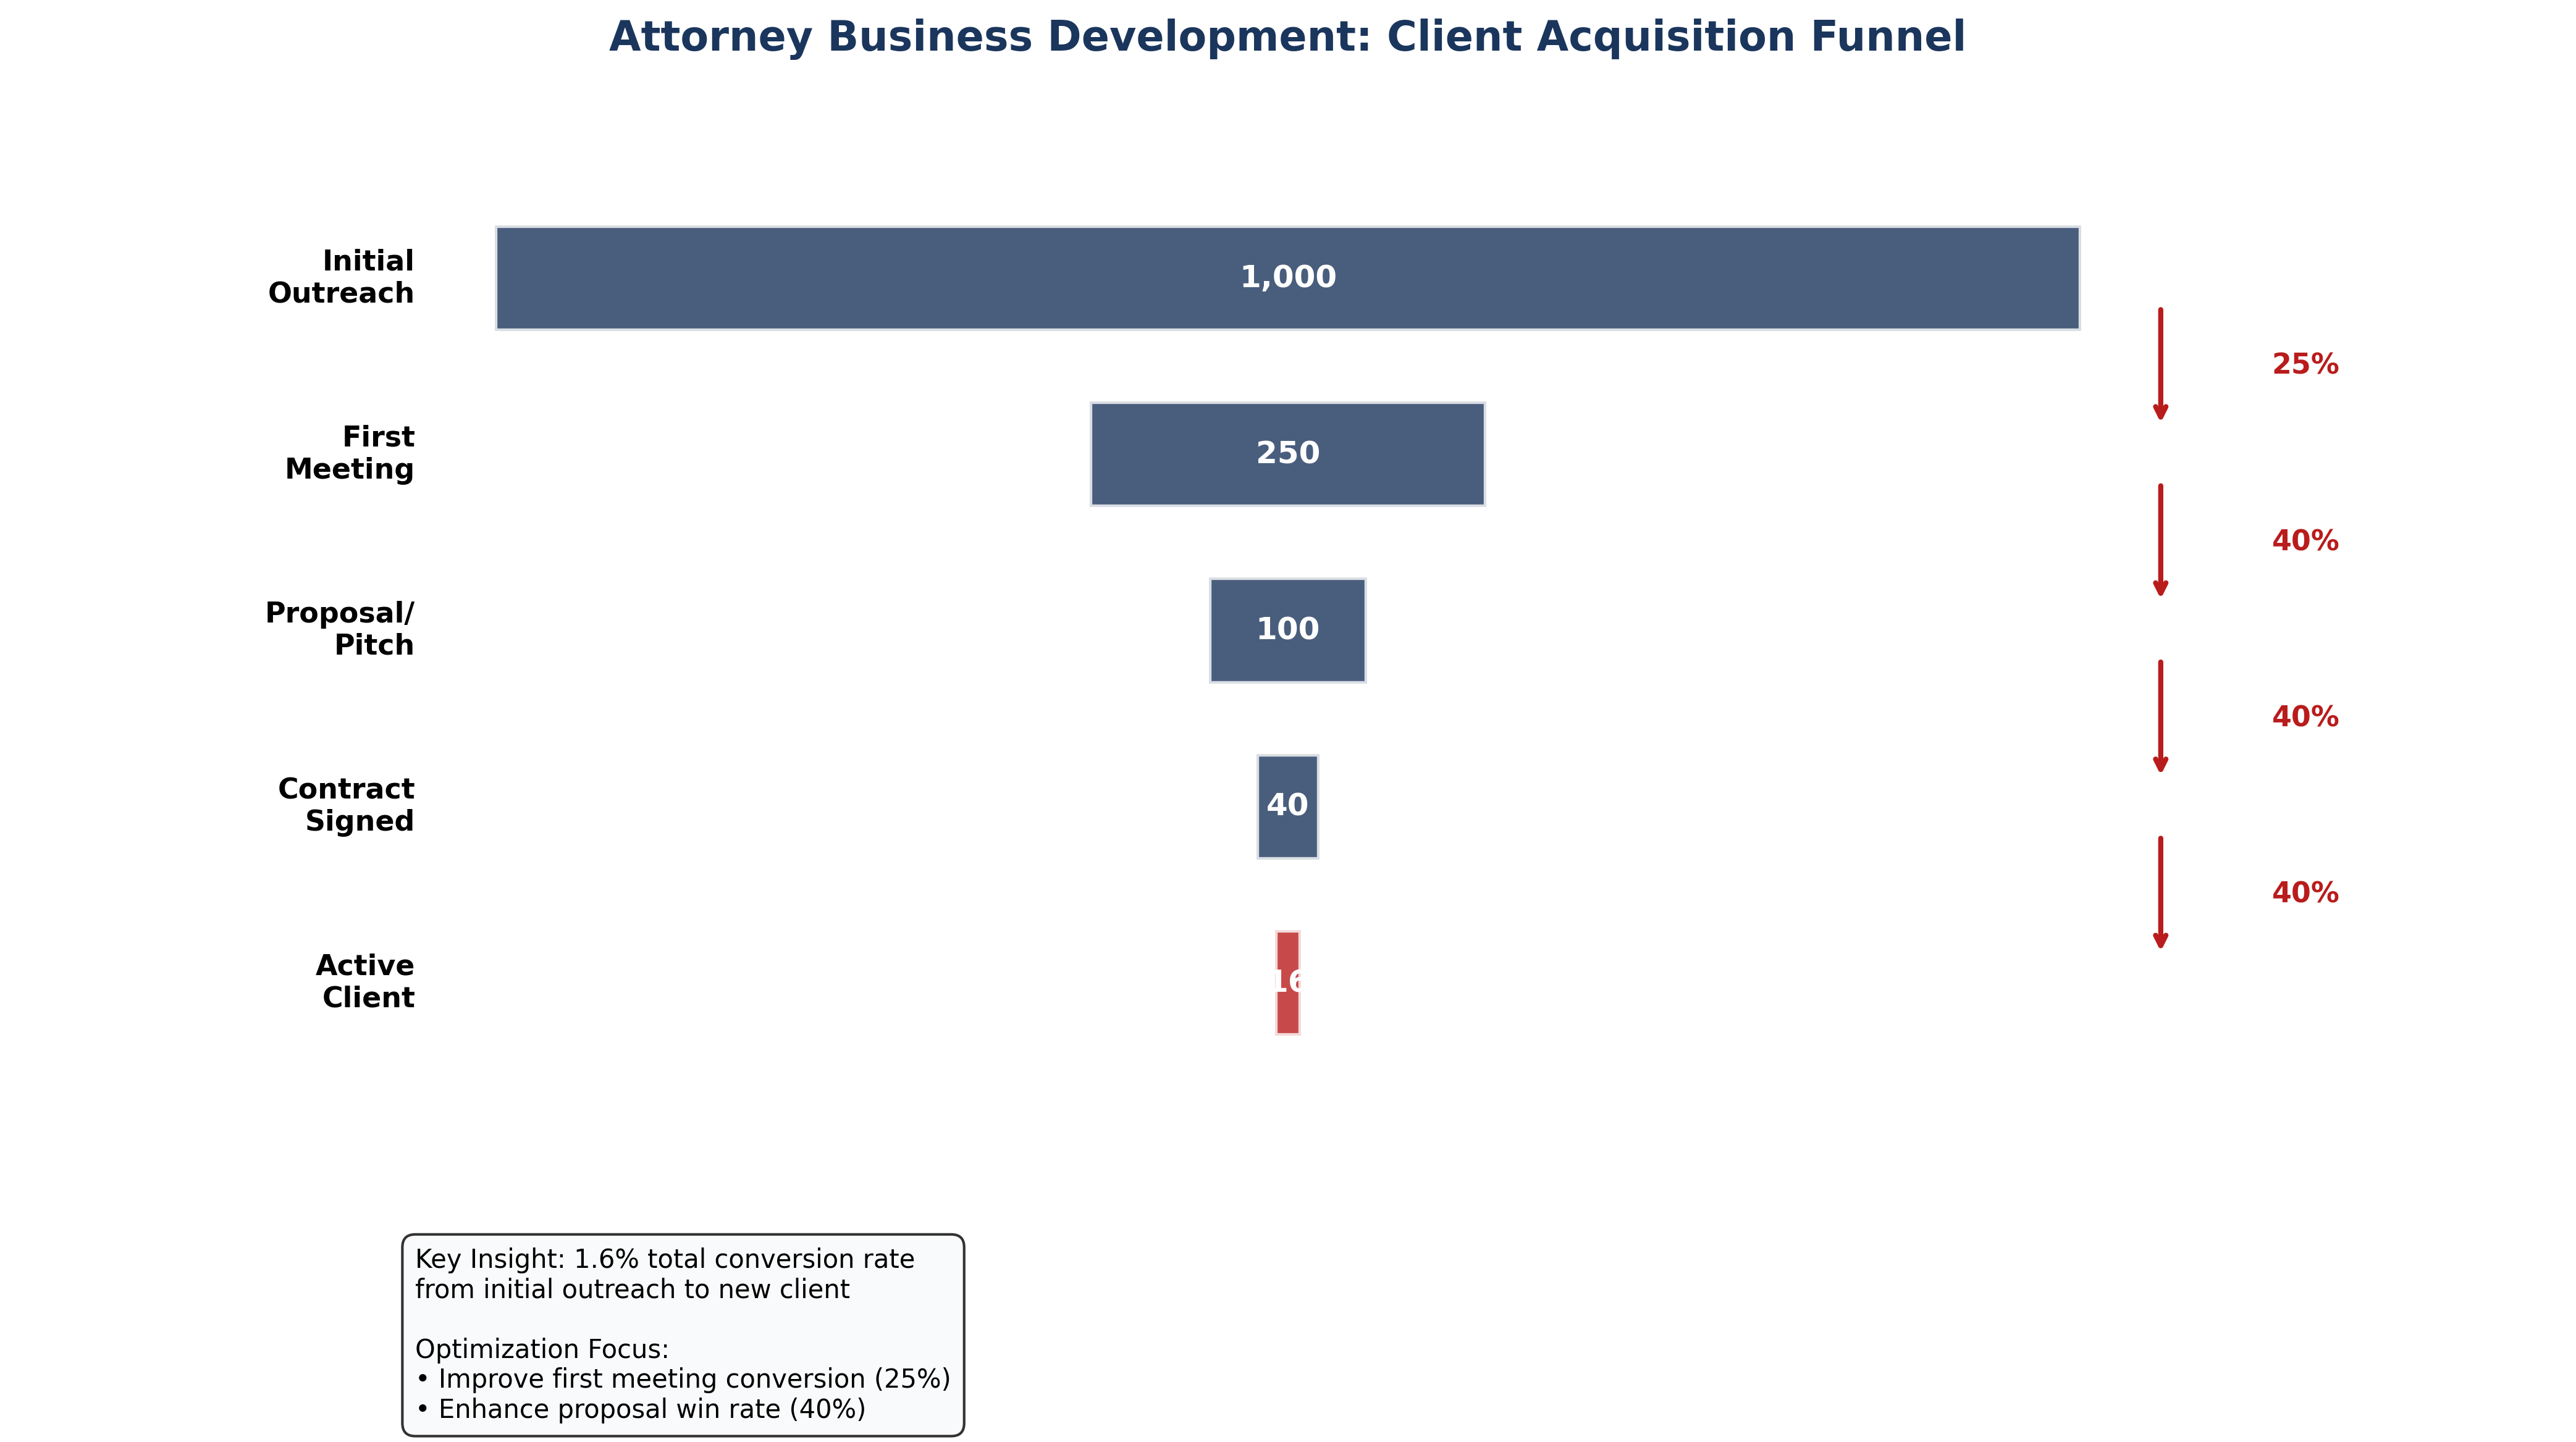
Figure 1: Attorney Business Development Client Acquisition Funnel – Only 1.6% of initial outreach converts to new clients, highlighting critical optimization opportunities at each stage.
Understanding Your Conversion Reality
The data reveals a sobering reality: out of 1,000 initial outreach contacts, only 16 become active clients — a 1.6% total conversion rate. However, this baseline provides clear opportunities for systematic improvement at each stage.
Stage-by-Stage Breakdown
- Initial Outreach → First Meeting (25%): Biggest opportunity for improvement through better targeting and messaging
- First Meeting → Proposal (40%): Focus on qualification and value demonstration
- Proposal → Contract (40%): Optimize pricing strategy and closing techniques
- Contract → Active Client (40%): Ensure smooth onboarding and expectation management
Funnel Optimization Checklist
Improving Your Conversion Rates
Small improvements at each stage compound dramatically. Improving each stage by just 10 percentage points would result in:
Current: 1,000 → 250 → 100 → 40 → 16 clients (1.6%)
Improved: 1,000 → 350 → 175 → 87 → 43 clients (4.3%)
169% increase in new client acquisition!
Business Development ROI Analysis
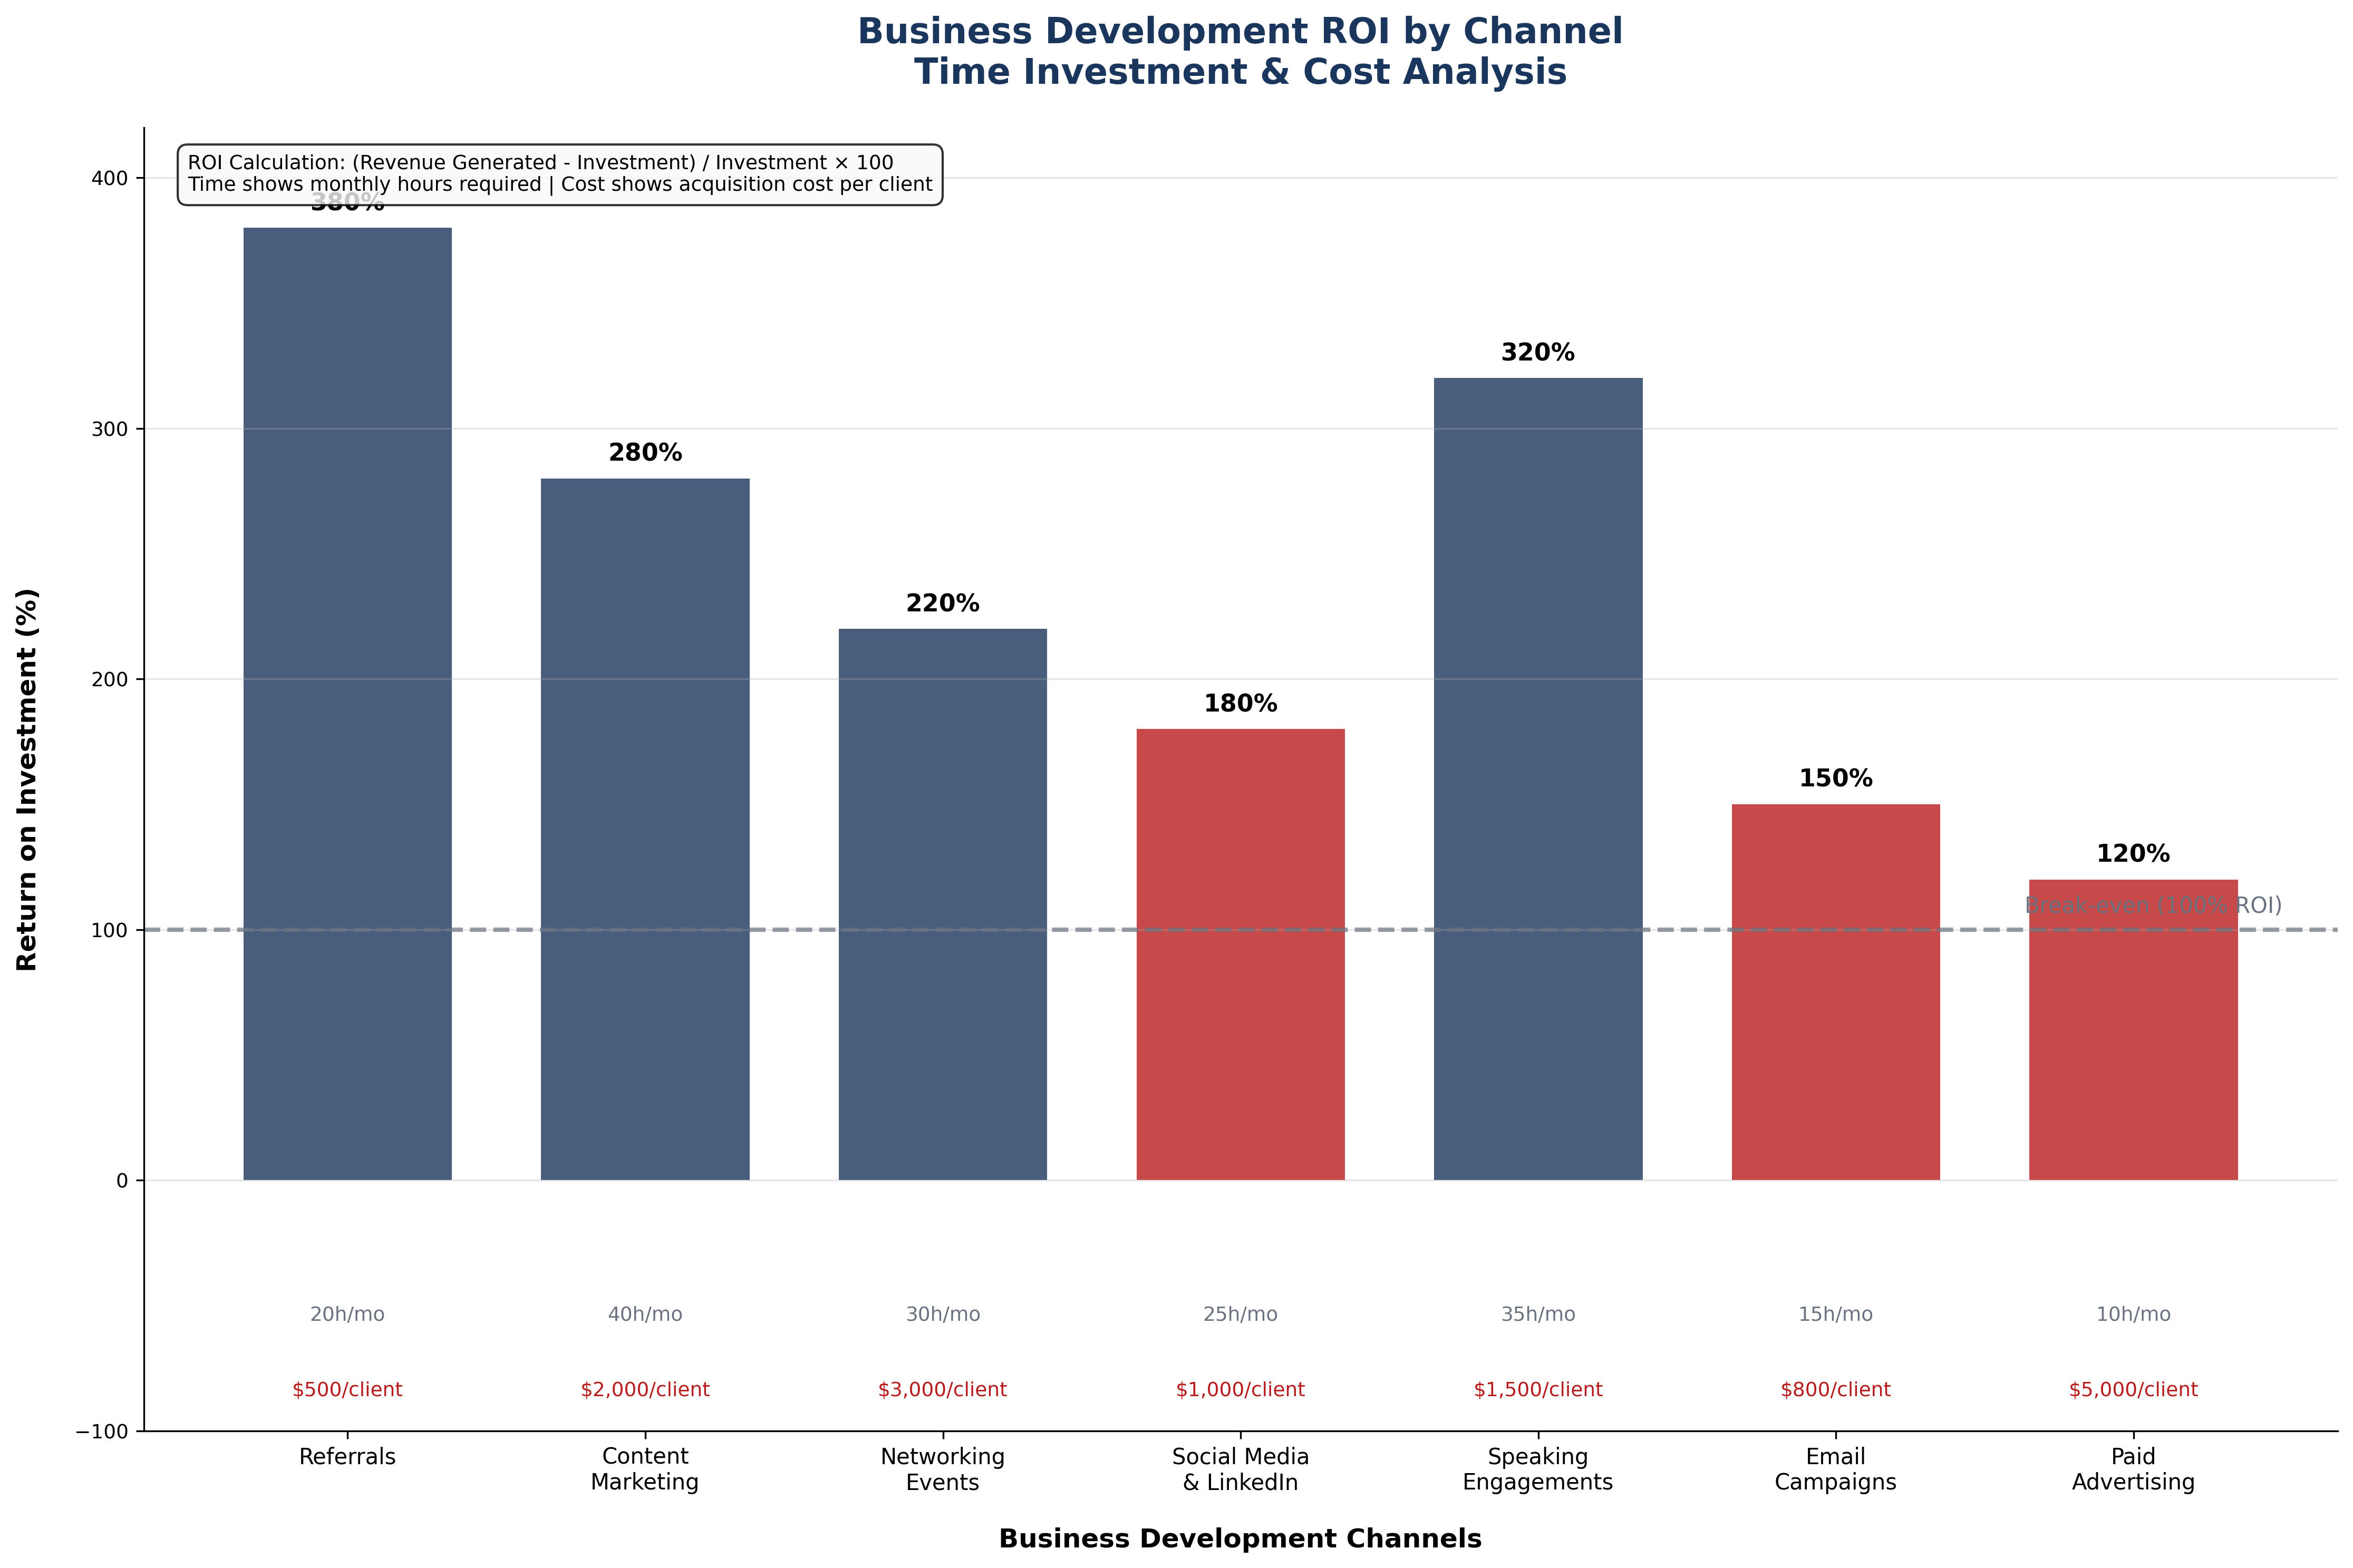
Figure 2: Business Development ROI by Channel – Referrals deliver 380% ROI with only 20 hours monthly investment, making it the most efficient channel for attorney business development.
The Referral Advantage
The data conclusively shows that referrals generate the highest ROI at 380%, requiring only 20 hours per month and costing just $500 per client acquisition. This makes referral systems the cornerstone of any successful attorney business development strategy.
Channel Selection Strategy
High-Priority Channels (ROI > 200%)
- Referrals (380% ROI): Prioritize existing client relationships and referral partner cultivation
- Speaking Engagements (320% ROI): Target 3-4 strategic speaking opportunities annually
- Content Marketing (280% ROI): Develop systematic content creation and distribution
Secondary Channels (ROI 150-200%)
- Networking Events (220% ROI): Select high-value events aligned with target clients
- Social Media (180% ROI): Focus on LinkedIn for professional networking
- Email Campaigns (150% ROI): Nurture existing relationships and prospects
Resource Allocation Framework
Based on ROI analysis, attorneys should allocate their business development time and budget according to the following framework:
Outreach Timing Optimization

Figure 3: Optimal Outreach Timing Heatmap – Wednesday 8-10 AM achieves 28% response rates while Friday afternoons drop below 12%, demonstrating the critical importance of strategic timing.
The Science of Response Timing
Our analysis reveals that strategic timing can increase response rates by up to 133%. The optimal window—Wednesday 8-10 AM—achieves a 28% response rate, compared to just 12% for Friday afternoon outreach. This data-driven approach to timing can dramatically improve your outreach efficiency without any additional investment.
Peak Performance Windows
- Wednesday 8-10 AM (28%): Peak productivity window for decision-makers
- Tuesday 8-10 AM (25%): Second-best option for important outreach
- Thursday 8-10 AM (26%): Reliable alternative for systematic campaigns
- Monday 8-10 AM (22%): Good but avoid after holidays or long weekends
Times to Avoid
- Friday 12-6 PM (8-10%): Lowest response rates across all time slots
- Any day 4-6 PM (12-15%): End-of-day mental fatigue affects engagement
- Monday 12-2 PM (12%): Post-weekend catch-up period
- Any lunch period (8-16%): Interrupts natural workflow
Weekly Outreach Calendar Template
| MON | TUE | WED | THU | FRI | SAT | SUN |
|---|---|---|---|---|---|---|
| 8-10 AM New Prospects (22%) |
8-10 AM VIP Outreach (25%) |
8-10 AM Priority Contacts (28%) |
8-10 AM Follow-ups (26%) |
Avoid Outreach (15%) |
Personal Development |
Strategy Planning |
| 10-12 PM Warm Leads (18%) |
10-12 PM Content Sharing (22%) |
10-12 PM Referral Thank-yous (24%) |
10-12 PM Check-ins (20%) |
Administrative Only (12%) |
Personal Time |
Family Time |
Usage: Schedule your most important outreach during green zones, routine communications during yellow zones, and avoid red zones for any client-facing activities.
Implementation Strategy
Referral Network Systems
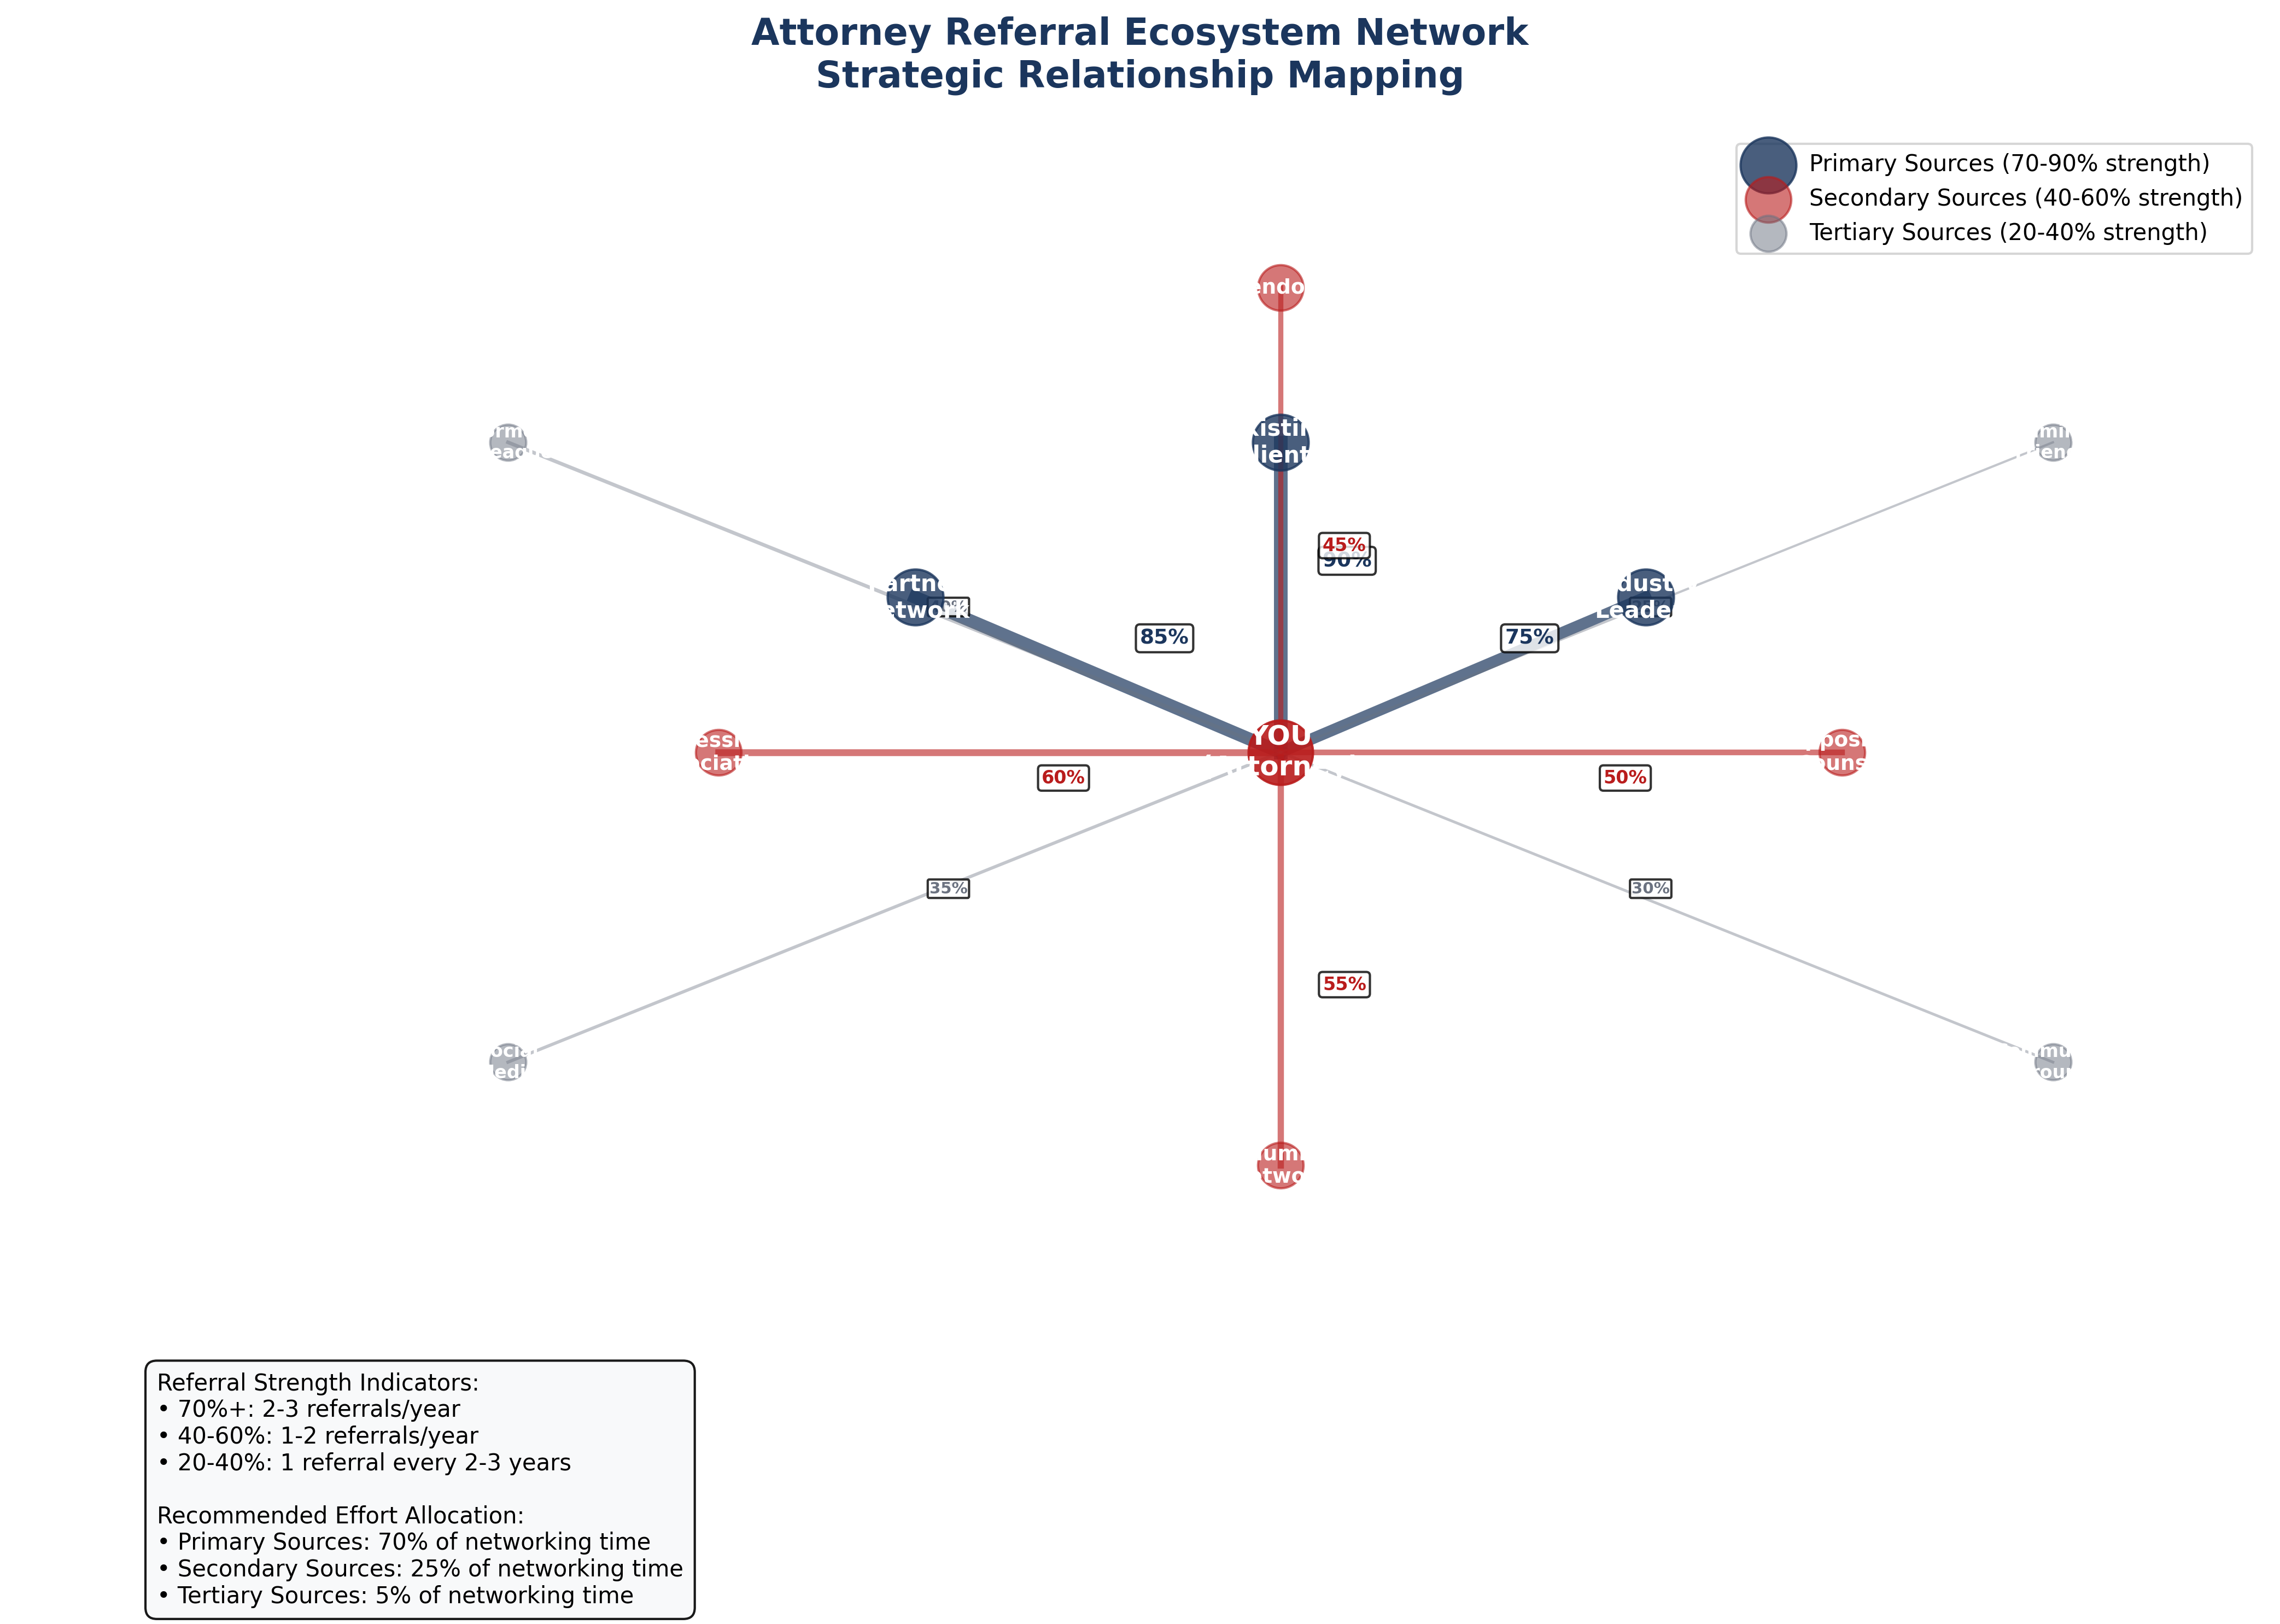
Figure 4: Attorney Referral Ecosystem Network - Strategic mapping of referral sources showing connection strength percentages and recommended effort allocation across three tiers.
The Referral Ecosystem Framework
With 380% ROI, referrals represent your highest-leverage business development activity. This ecosystem model strategically categorizes your referral sources into three tiers based on referral frequency and strength, enabling focused effort allocation for maximum impact.
Primary Sources (70-90% Strength)
- Existing Clients: Your strongest advocates with direct experience
- Partner Network: Other attorneys in complementary practices
- Industry Leaders: Recognized experts who know your work
Expected: 2-3 referrals/year each
Effort: 70% of referral time
Secondary Sources (40-60% Strength)
- Professional Associations: Industry organization members
- Alumni Network: Law school and previous firm connections
- Opposing Counsel: Respected adversaries who know your skills
- Vendors: Service providers who see your professionalism
Expected: 1-2 referrals/year each
Effort: 25% of referral time
Tertiary Sources (20-40% Strength)
- Social Media: LinkedIn and professional platform connections
- Community Groups: Local business and civic organizations
- Family/Friends: Personal network aware of your practice
- Former Colleagues: Previous workplace relationships
Expected: 1 referral every 2-3 years
Effort: 5% of referral time
Systematic Referral Cultivation
Monthly Referral Activities Checklist
Primary Source Activities (70% effort)
Secondary Source Activities (25% effort)
Referral Success Metrics to Track
Content Marketing Strategy
Content marketing delivers 280% ROI and creates a multiplier effect where one strategic article generates 8+ touchpoints and 2-5 qualified leads through systematic repurposing and distribution.
The Content Multiplication Formula
A single high-quality article becomes:
- LinkedIn article + social posts
- Email newsletter content
- Speaking engagement material
- Video/podcast content
- Client presentation slides
- SEO-optimized web content
- Industry publication submission
- Follow-up conversation starters
Quarterly Content Planning Template
Q1: Foundation
- Industry trend analysis
- "Year ahead" predictions
- Case study deep-dive
Q2: Expertise
- Complex legal issue breakdown
- Regulatory update impact
- Client success story
Q3: Leadership
- Industry controversy analysis
- Future-focused perspective
- Thought leadership piece
Q4: Reflection
- Year-end industry review
- Lessons learned compilation
- Next year preparation
Performance Dashboard
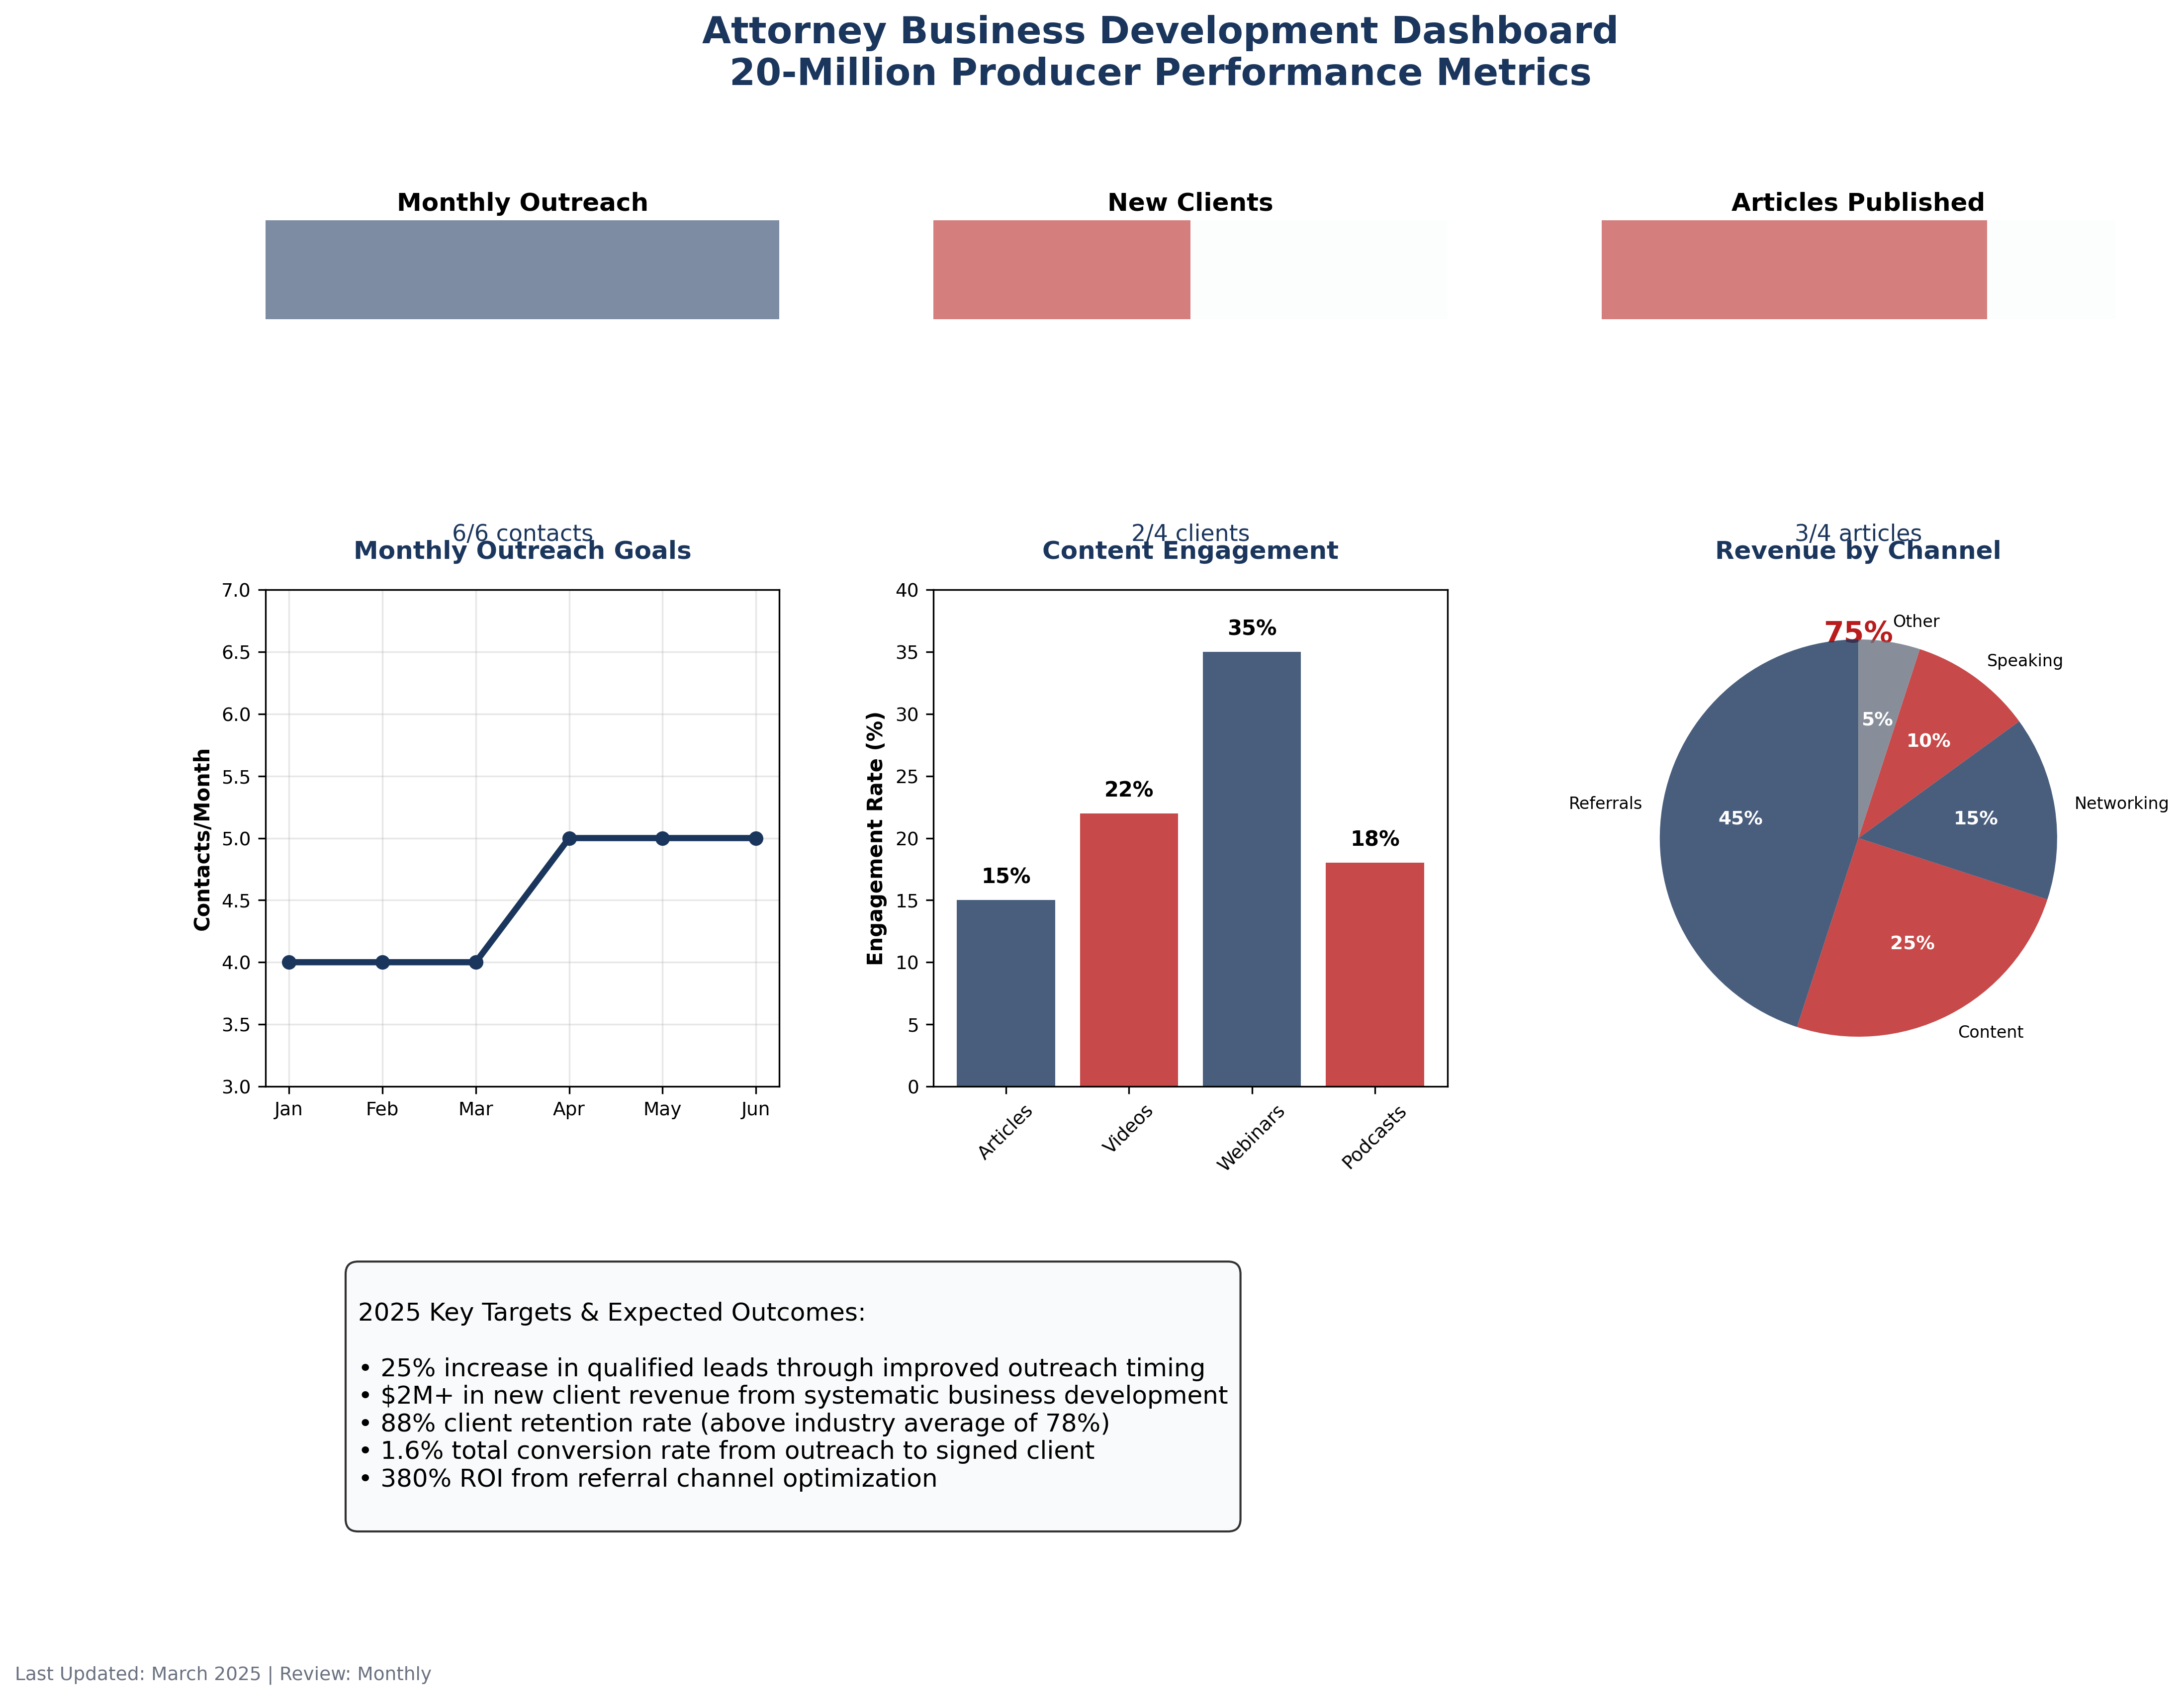
Figure 5: Attorney Business Development Dashboard - Comprehensive KPI tracking for 20-Million Producer showing progress on outreach goals, content engagement, and revenue attribution across channels.
Key Performance Indicators
Successful business development requires systematic measurement and course correction. This dashboard framework tracks the metrics that correlate most directly with new client acquisition and revenue growth.
Weekly Tracking Template
Use this checklist to maintain momentum on key business development activities:
Weekly Metrics
Weekly Activities
Client Retention Analysis
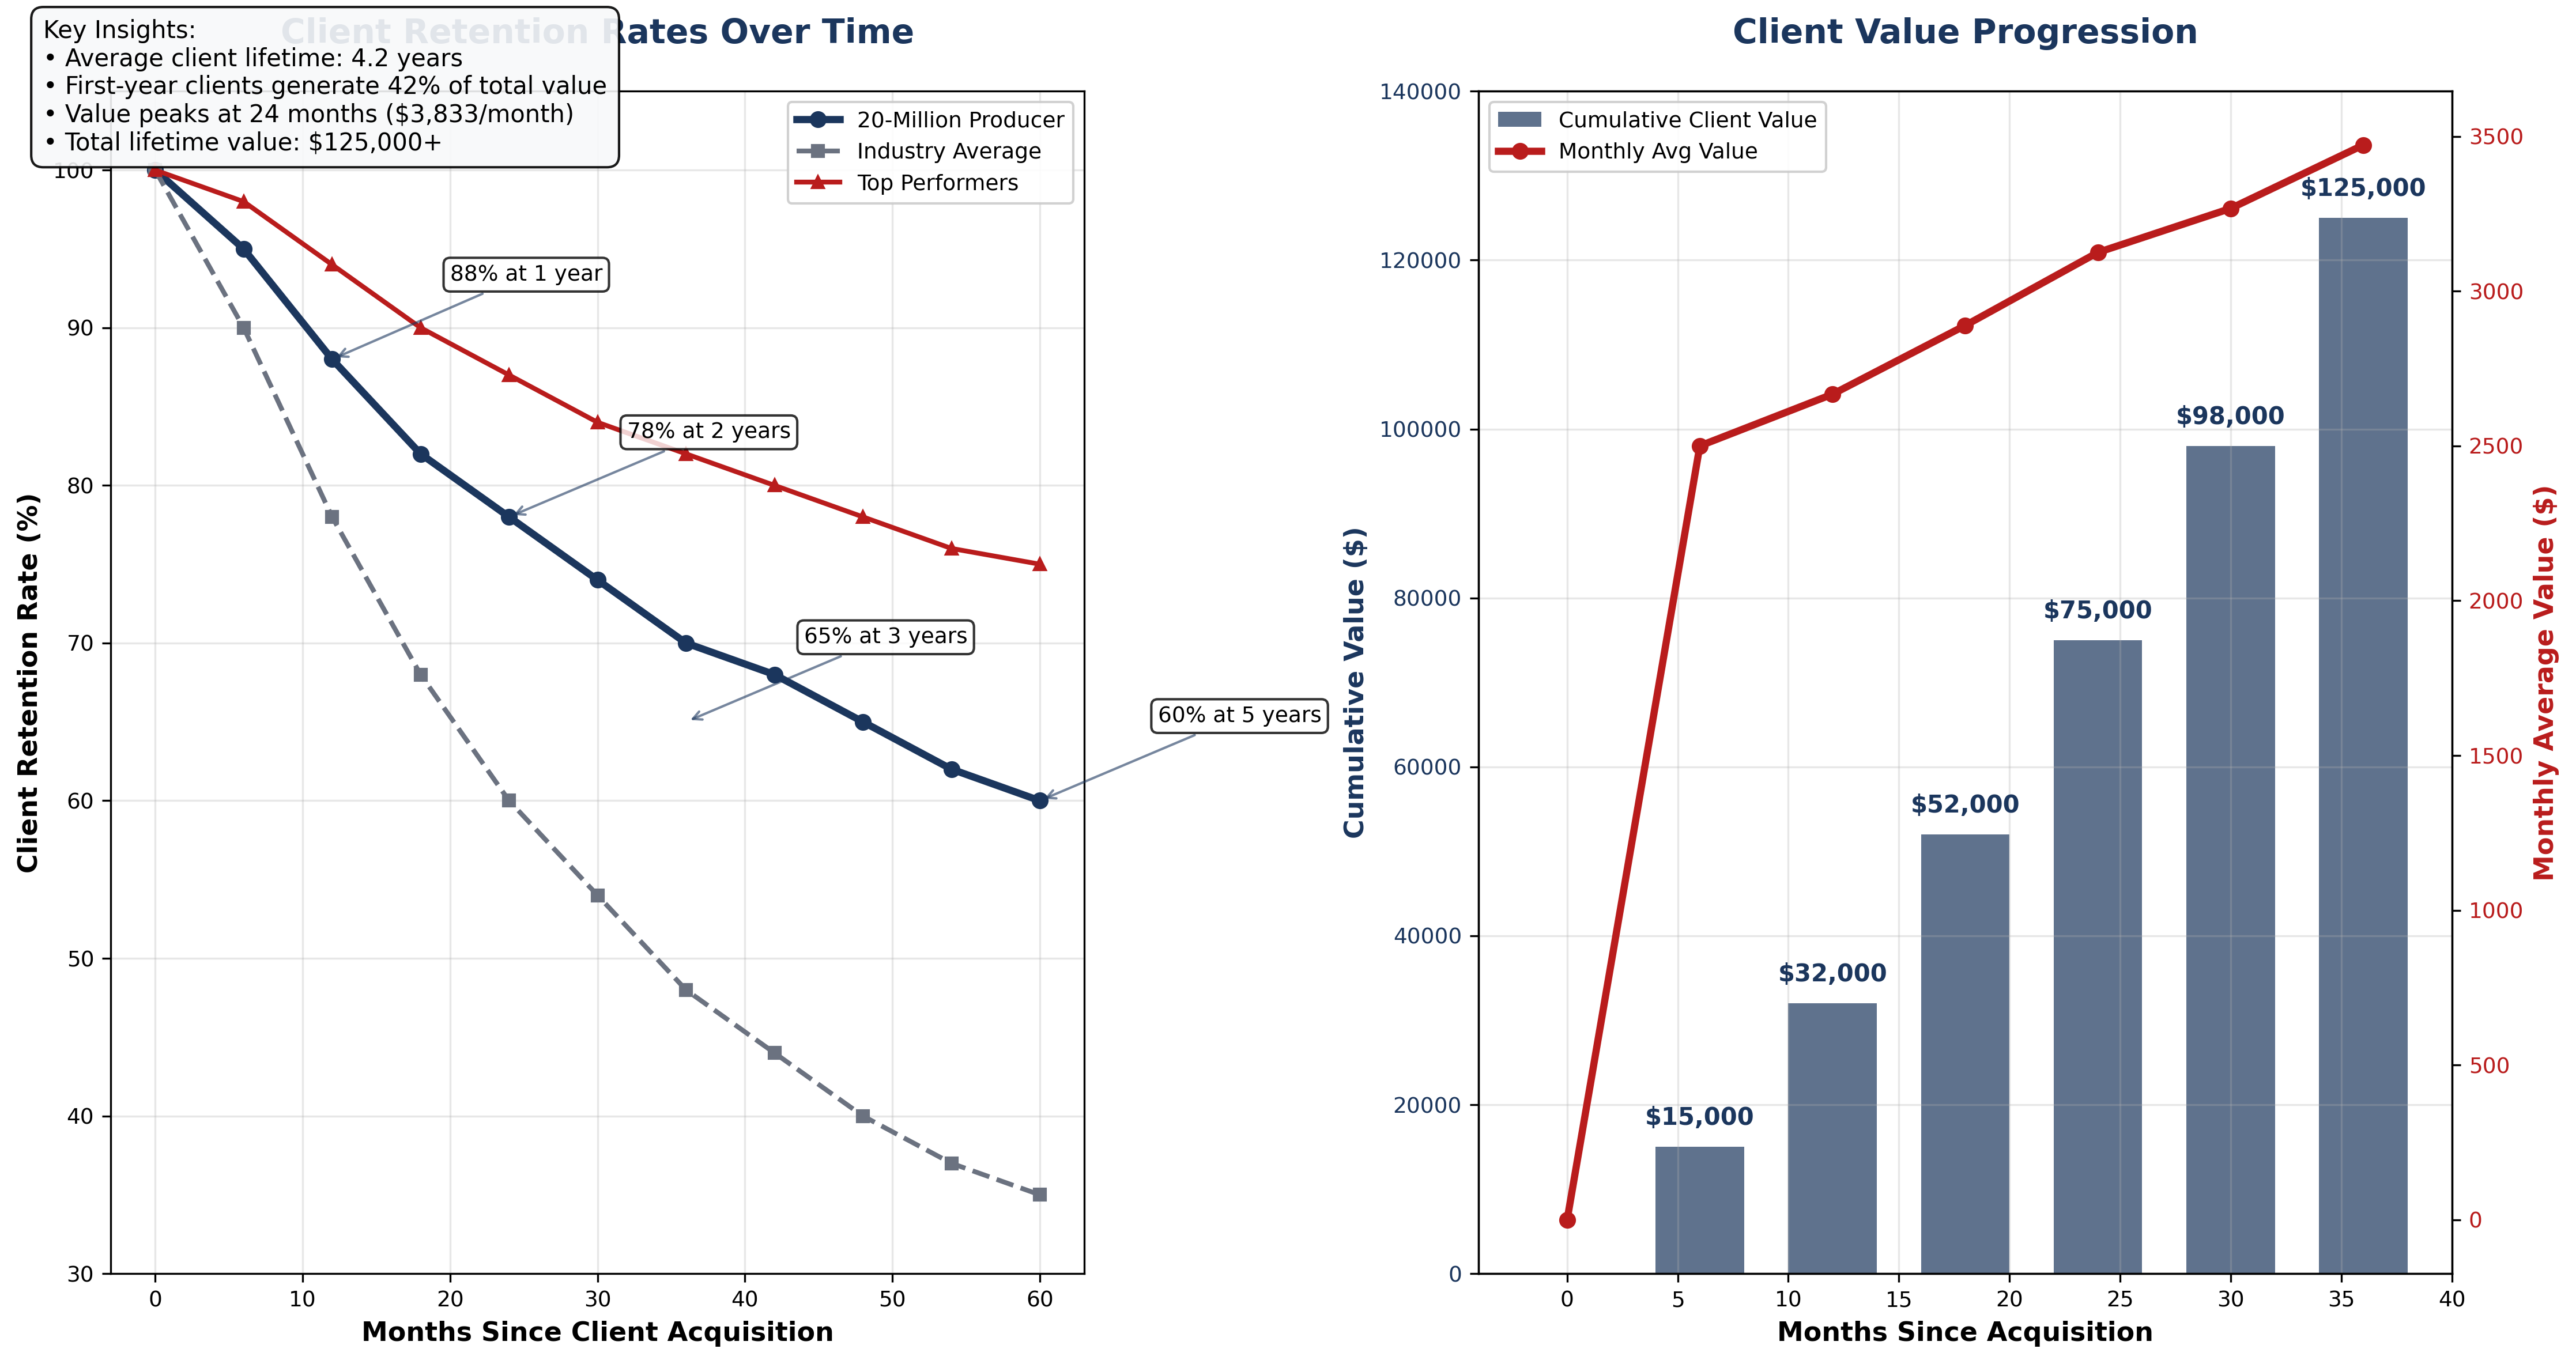
Figure 6: Client Retention Analysis - 20-Million Producer maintains 88% retention at 12 months (vs 78% industry average) with average client lifetime value exceeding $125,000.
The Long-Term Value Equation
Client retention directly correlates with profitability. A 20-million producer maintains 88% retention at 12 months compared to the industry average of 78%. This 10 percentage point difference compounds over time, resulting in significantly higher lifetime client value and reduced acquisition costs.
Retention Strategy Framework
Client Lifecycle Management
Onboarding (0-90 days)
- Welcome package with expectations
- Dedicated contact assignment
- 30/60/90 day check-ins
- Process explanation meetings
Engagement (3-12 months)
- Regular progress updates
- Industry insights sharing
- Quarterly business reviews
- Value demonstration reports
Growth (1-3 years)
- Cross-service opportunities
- Strategic planning sessions
- Industry event invitations
- Referral conversations
Advocacy (3+ years)
- VIP treatment and access
- Speaking opportunities
- Case study participation
- Advisory board invitations
Retention Rate Impact on Business Value
A 5% improvement in retention rate increases profits by 25-95%. Here's how retention improvements compound:
2025 Business Plan: 20-Million Producer Analysis
Strategic Plan Overview
This analysis examines the complete 2025 business development plan of a successful $20-million producer from BCG Attorney Search, breaking down their systematic approach to client acquisition, relationship building, and revenue growth.
2025 Key Objectives
Quantitative Goals
- Monthly Outreach: Increase from 4 to 6 contacts per month
- New Clients: Target 4 new clients annually (up from 2)
- Content Creation: 4 articles per quarter + video content
- Speaking Engagements: 3 industry meetings annually
- Legal Primers: Expand to 6 specialized primers annually
Strategic Initiatives
- CRM Implementation: Systematize with HubSpot or Salesforce
- Social Media Expansion: LinkedIn + Twitter daily engagement
- Client Loyalty Program: Quarterly check-ins and appreciation
- Referral Incentive Program: Structured appreciation system
- Cross-Selling Task Force: Monthly opportunity identification
Content Strategy Implementation
Written Content
- 4 articles annually (quarterly)
- Published on LinkedIn, firm website
- High-traffic platforms (JD Supra, Medium)
- SEO optimized for visibility
- White papers on trending topics
- Co-branded content with partners
Speaking & Video
- 3 industry speaking engagements
- Webinars and podcast appearances
- 2-5 minute educational videos
- YouTube and LinkedIn video posts
- Bi-weekly podcast series launch
- Quarterly client webinars
Digital Marketing
- LinkedIn weekly updates and engagement
- Daily Twitter insights and commentary
- Instagram for firm culture content
- Google My Business optimization
- Monthly newsletter campaigns
- Targeted LinkedIn ads for decision-makers
Relationship Building Framework
Systematic Relationship Management
Existing Clients
- Client loyalty program implementation
- Free legal seminars for top clients
- Thank you campaigns (gifts, notes)
- Quarterly check-in calls/meetings
- Exclusive resource sharing
Potential Clients
- Virtual industry roundtables
- Client targeting campaigns
- Tailored presentations for prospects
- Free initial consultation offers
- Decision-maker networking events
Referral Sources
- Referral appreciation program
- Quarterly thank-you calls
- Personal relationship maintenance
- Industry insight sharing
- Reciprocal referral opportunities
Expected Outcomes & ROI
Templates & Worksheets
Monthly Business Development Planner
Client Outreach Email Template
Subject: [Specific industry insight/opportunity]
Dear [Name],
I came across [specific industry development/news] and immediately thought of [client's business/situation]. This could [specific impact/opportunity for their business].
[Brief insight or analysis - 2-3 sentences]
If you'd like to discuss how this might affect [their specific situation], I'm happy to set up a brief call. I have some thoughts on [specific strategies/solutions].
Best regards,
[Your name]
[Contact information]
Success Rate: 28% response rate when sent Wednesday 8-10 AM
Referral Thank You Template
Subject: Thank you for the [Client name] referral
Dear [Referrer name],
Thank you for referring [Client name] to our firm. I wanted to update you that we had an excellent initial meeting and [brief outcome - signed engagement/moving forward with consultation/etc.].
Your confidence in our abilities means a great deal, and [Client name] mentioned how highly you spoke of our work. We're committed to delivering the exceptional service that reflects well on your recommendation.
I'd love to take you to lunch soon to catch up and discuss [relevant industry topic/mutual interest]. I'll call next week to find a time that works.
With sincere appreciation,
[Your name]
Annual Business Development Budget Worksheet
| Channel | Annual Budget | Expected ROI | Time Investment |
|---|---|---|---|
| Referral Systems | $___________ | 380% | 240 hrs/year |
| Content Marketing | $___________ | 280% | 480 hrs/year |
| Speaking Engagements | $___________ | 320% | 420 hrs/year |
| Networking Events | $___________ | 220% | 360 hrs/year |
| Digital Marketing | $___________ | 180% | 300 hrs/year |
| Technology/CRM | $___________ | 150% | 120 hrs/year |
30/60/90-Day Implementation Roadmap
First 30 Days: Foundation
Week 1-2: Assessment & Setup
Week 3-4: Initial Outreach
Days 31-60: Momentum
Week 5-6: System Optimization
Week 7-8: Content Multiplication
Days 61-90: Scale & Measure
Week 9-10: Advanced Strategies
Week 11-12: Analysis & Planning
Success Metrics to Track
50+
New CRM Contacts
15%+
Outreach Response Rate
3+
New Qualified Prospects
1
New Client Signed
Advanced Strategies & Technology Integration
AI-Powered Business Development
Modern attorney business development leverages artificial intelligence and automation to scale personal relationship building while maintaining authenticity and professional standards.
AI-Assisted Research & Personalization
- Prospect Intelligence: AI tools analyze news, financial reports, and social media to identify outreach opportunities
- Personalization at Scale: Generate customized talking points for each contact based on recent activities
- Sentiment Analysis: Monitor client sentiment across communications to identify relationship risks
- Competitive Intelligence: Track competitor activities and client movements for strategic insights
Marketing Automation Workflows
- Lead Scoring: Automatically rank prospects based on engagement and fit criteria
- Drip Campaigns: Multi-touch sequences tailored to prospect behavior and interests
- Event Triggers: Automatic outreach based on news, job changes, or company events
- Content Distribution: Intelligent content sharing based on recipient preferences and timing
Social Listening & Engagement Strategy
Digital Monitoring Framework
Monitor Keywords
- Your practice area + "legal issues"
- Target industries + "legal challenges"
- Competitor firm names and attorneys
- Regulatory changes in your specialty
- Client company names and executives
Engagement Opportunities
- Thoughtful comments on industry posts
- Sharing insights on trending topics
- Congratulating contacts on achievements
- Offering perspective on legal developments
- Connecting people in your network
Content Opportunities
- Quick analysis of breaking news
- "What this means for..." explanations
- Industry trend predictions
- Myth-busting common misconceptions
- Behind-the-scenes legal process
Attribution Modeling & ROI Optimization
Advanced attorneys track the complete client journey to understand which touchpoints actually drive conversions. This data enables strategic resource allocation and budget optimization.
Multi-Touch Attribution Framework
| Touchpoint | Attribution Weight | Typical Impact | Measurement Method |
|---|---|---|---|
| First Touch (Awareness) | 20% | Brand Recognition | UTM tracking, referral source |
| Content Engagement | 15% | Trust Building | Content downloads, time spent |
| Speaking/Events | 25% | Authority Establishment | Event attendance tracking |
| Referral Introduction | 30% | Trust Transfer | Referral source identification |
| Direct Outreach | 10% | Conversion Catalyst | Email/call tracking, response rates |
Scaling Through Systems & Team
Delegation Framework
- Marketing Coordinator: Content creation, social media management, event coordination
- Business Development Assistant: CRM management, follow-up scheduling, research
- Client Relations Manager: Onboarding, check-ins, loyalty program management
- Technology Specialist: Automation setup, analytics reporting, system integration
Process Documentation
- Standard Operating Procedures: Document all repeatable processes for consistency
- Quality Control Checklists: Ensure brand consistency across all touchpoints
- Performance Metrics: Establish KPIs and review schedules for continuous improvement
- Training Materials: Create resources for new team members and ongoing education
Conclusion & Next Steps
The path to $20-million production is not built on luck or natural charisma—it's constructed through systematic execution of proven strategies, data-driven optimization, and relentless focus on relationship building at scale.
Immediate Actions
- Complete self-assessment diagnostic
- Implement CRM system this week
- Schedule outreach for Wed 8-10 AM
- Plan first strategic content piece
- Map your referral ecosystem
30-Day Focus
- Execute 15 strategic outreach contacts
- Publish and distribute first article
- Schedule 5 referral partner meetings
- Set up automated follow-up sequences
- Begin tracking all business development activities
90-Day Goals
- Achieve 20%+ outreach response rate
- Secure first speaking engagement
- Launch client loyalty program
- Generate 3+ qualified prospects
- Sign first new client from systematic approach
Your Success Formula
Systematic Outreach + Strategic Timing + Content Multiplication + Referral Systems + Consistent Measurement = Sustainable Growth
The Data Doesn't Lie
- 1.6% conversion rate provides your baseline—small improvements compound dramatically
- 380% ROI from referrals makes relationship building your highest priority
- 28% response rate from optimal timing proves strategy beats effort
- $125,000 lifetime client value justifies significant acquisition investment
- 88% retention rate separates top producers from average performers
The attorneys who implement these systems consistently, measure their progress rigorously, and optimize based on data will separate themselves from competitors still relying on hope and networking events. Your practice is a business—treat it like one, and it will reward you like one.